This repository was archived by the owner on Feb 27, 2024. It is now read-only.
This repository was archived by the owner on Feb 27, 2024. It is now read-only.
All values above threshold not displaying changes #15
Description
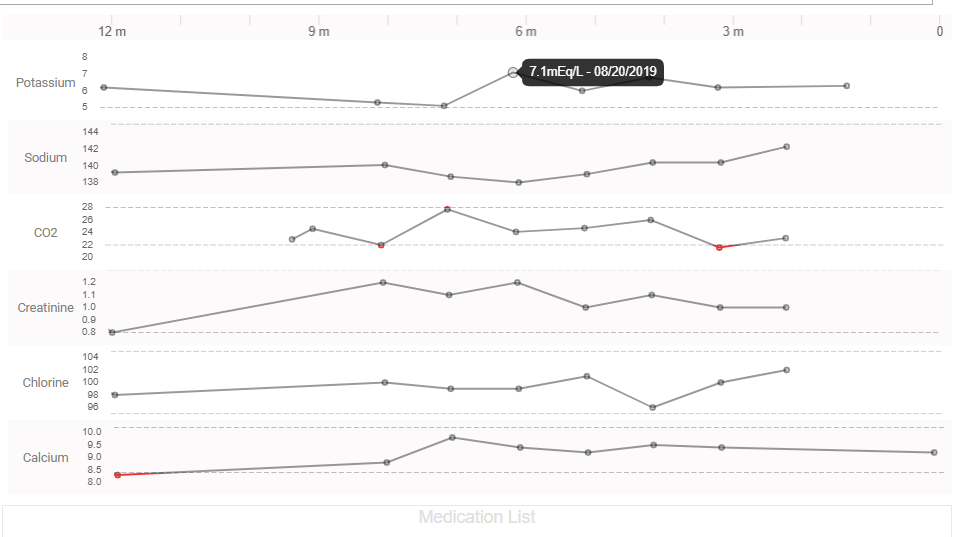
I am testing use cases and my band line is working as long as there is a point that falls within the threshold. In more extreme cases when all values are above the line (which is seen here in potassium which has a max threshold of 5) the line graph should be completely red; however, when all the points fall above the max threshold OR when all the points fall below the min threshold, there are no changes to the line.