This repository was archived by the owner on Feb 27, 2024. It is now read-only.
This repository was archived by the owner on Feb 27, 2024. It is now read-only.
belowThreashholdColour has no effect when yValue not visible #7
Description
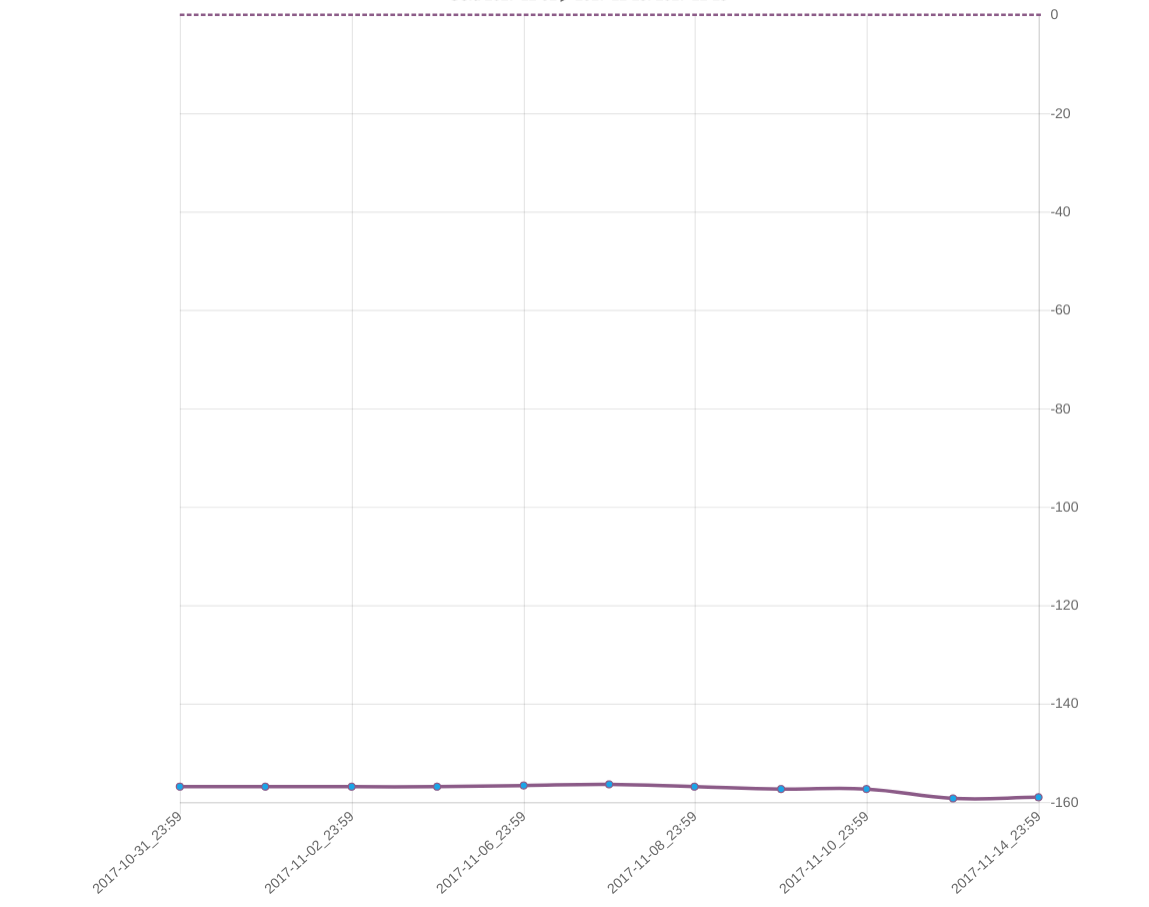
I use the following configuration to draw a line chart:
scales: {
                yAxes: [{
                    position: "right",
                    ticks: {
                        beginAtZero: false
                    }
                }]
            },
bands: {
                yValue: 0,                // The threshold value on the yAxis (default is false)
                bandLine: { 	              // The display properties of the threshold line
                    stroke: 2,
                    colour: '#8B5A87',
                    type: 'dashed'
                },
                baseColorGradientColor: [
                    '#8B5A87'
                ],
                belowThresholdColour: [      // An array of the colors that describes the below threshold colour to use the above threshold color is inherited from the dataset
                    '#8B5A87'
                ]
            }
When I set beginAtZero to true, I see the threshold line and the line is colored as expected.