Axis cut when using plot_individual_variable_effect.R with grid.arrange() #32
Description
Hello!
I am using plot_individual_variable_effect() and getting an unexpected behavior. My graph looks like this (note that the right y-values --- in pink --- are being cut off):
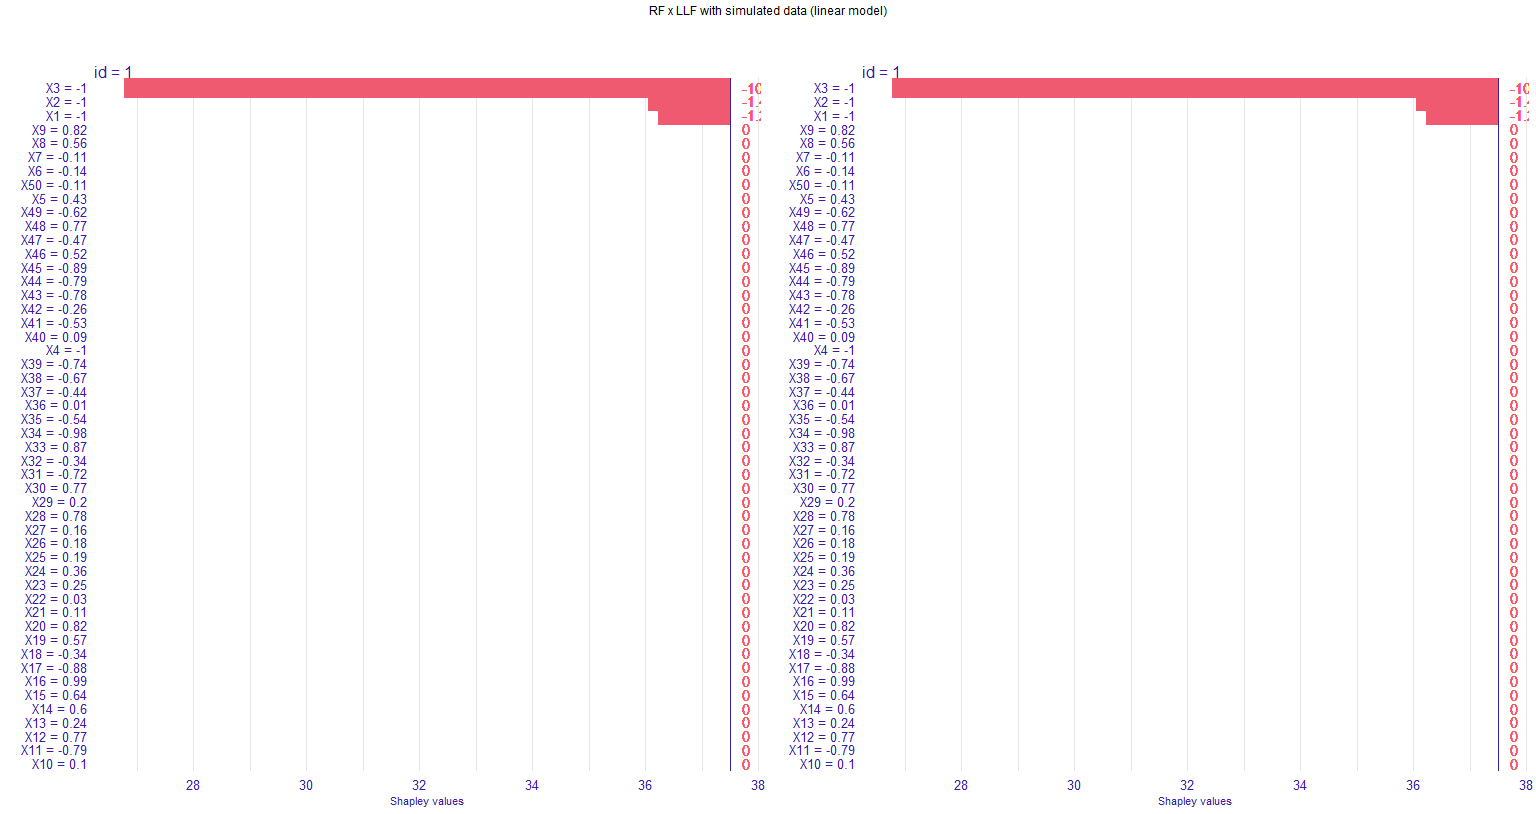
In my dataset, the Shapley values for all relevant variables are in the same direction, such that my bar plot only goes to the right. The values end up being cut from the graph when I use grid.arrange() to put two figures together. I tried to change the plot theme (using element_text()), but for some reason that "second" y-axis is unaffected.
I tried to plot without grid.arrange() (just using plot(g1, g2)), but this doesn't work (only one graph is displayed). I also tried to put some margins in the grid.arrange() by using grobs(); the graphs shrink but the axis values are still being cut.
Any ideas on how I can get the plot without the 'right' y-axis being cut?
Here a working code:
# Verify if a package is installed, if not, download and install before loading.
chooseCRANmirror(graphics = FALSE, ind = 10)
if (!require("pacman")) install.packages("pacman")
pacman::p_load(ggplot2, gridExtra, knitr, grid,randomForest, shapper, grf)
n = 1000
p = 50
sigma2 = 4
m = 50
sigma <- sqrt(sigma2)
X <- matrix(runif(n * p, -1, 1), nrow = n)
# Creates a new X matrix
X.test <- matrix(runif(m * p, -1, 1), nrow = m)
ticks <- seq(-1, 1, length = m)
# Computes Y and the test data
mu <- function(x1, x2, x3, x4){36+3.5*x1+3.25*x2+12*x3+0.01*x4}
Y <- mu(X[,1], X[,2], X[,3], X[,4]) + sigma * rnorm(n)
X.test[,1:4] <- ticks
# Fit the models
# Model using the regular random forest
forest <- regression_forest(X, Y)
# Local linear forest
ll.forest <- ll_regression_forest(X, Y, enable.ll.split = TRUE)
# Get the graphs from shapper
dfX <- data.frame(X)
dfY <- data.frame(Y)
dftestX <- data.frame(X.test)
ive_rf <- individual_variable_effect(forest, data = dfX[1:50,], new_observation = dftestX[1,])
plot(ive_rf, show_predicted = FALSE)
ive_llf <- individual_variable_effect(ll.forest, data = dfX[1:50,], new_observation = dftestX[1,])
ive_llf_filtered <- dplyr::filter(ive_rf, ylevel =="predictions")
g1 <- plot(ive_rf, show_predicted = FALSE, digits = 2)
g2 <- plot(ive_llf_filtered, show_predicted = FALSE, digits = 2)
# Plot g1 and g2 together as they are now cuts the right y axis
grid.arrange(g1, g2, nrow = 1, top=textGrob("RF x LLF with simulated data (linear model)", gp=gpar(fontsize=9,font=1)))
g1 <- g1 + theme(text = element_text(size = 8), strip.text.y = element_blank())
g2 <- g2 + theme(text = element_text(size = 8), strip.text.y = element_blank())
# Now the font size is decreased everywhere but the y-axis values are still being cut
grid.arrange(g1, g2, nrow = 1, top=textGrob("RF x LLF with simulated data (linear model)", gp=gpar(fontsize=9,font=1)))