Weird Dashboard #5678
Weird Dashboard
#5678
-
|
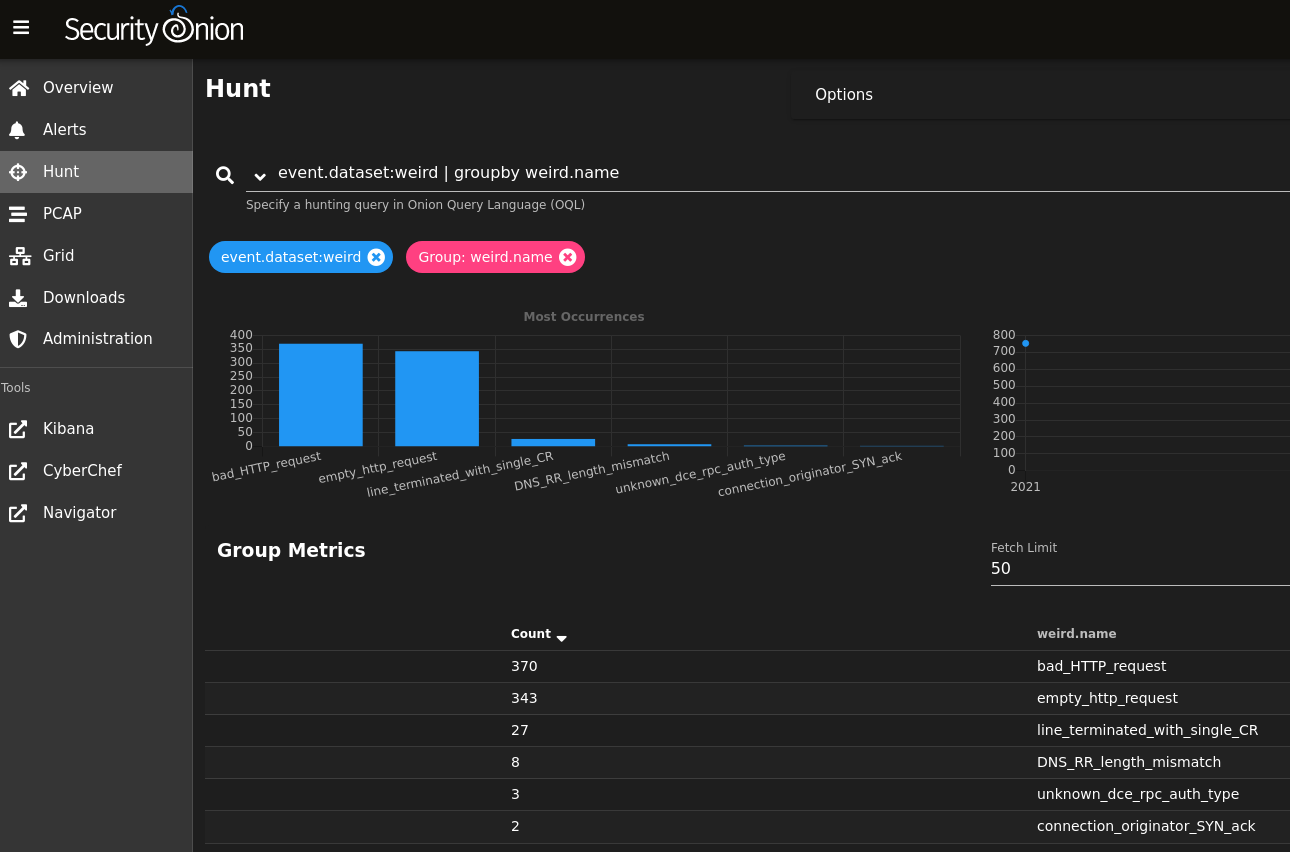
Hello all! It would be great if in the network dataset in kibana if a weird event.dataset option was available. Trying to get to the information about the weird (zeek) traffic is difficult. |
Beta Was this translation helpful? Give feedback.
Answered by
dougburks
Sep 28, 2021
Replies: 1 comment 1 reply
-
|
Have you tried the following options?
OR
OR
|
Beta Was this translation helpful? Give feedback.
1 reply
-
|
that make waaayyy too much sense. LOL Thank you! |
Beta Was this translation helpful? Give feedback.
Answer selected by
dougburks
Sign up for free
to join this conversation on GitHub.
Already have an account?
Sign in to comment
Have you tried the following options?
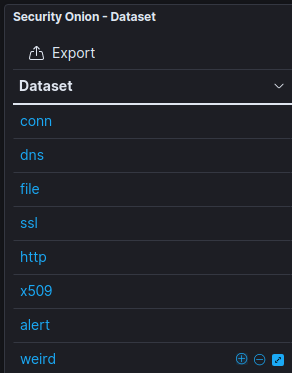
weirdor click the+sign to the right of it:OR
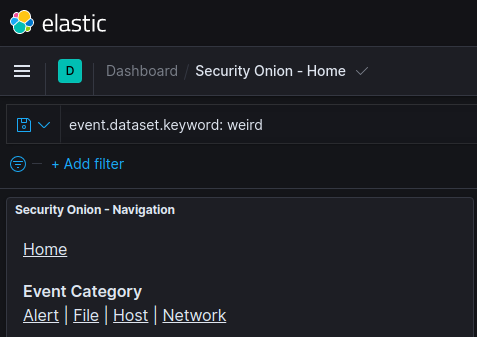
event.dataset.keyword: weird:OR