Request illustration magrittr pipe (%>%) #12
Description
Hello Allison Horsts
I want to know if you can make an illustration about the pipe (%>%) in the magrittr package.
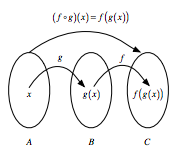
I have seen illustrations that try to explain the pipe but are really flat:
- https://res.cloudinary.com/dyd911kmh/image/upload/f_auto,q_auto:best/v1510846626/Pipe-Mathematical_gczmab.png
- https://altaf-ali.github.io/tidydata_tutorial/img/pipes.png
These illustrations are not bad if you want to explain the pipe. The problem is that they are not attractive for someone that is learning for the first time the pipe.
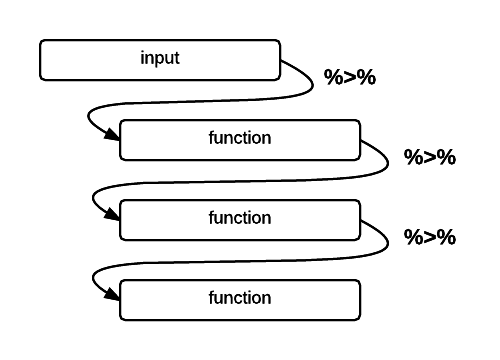
Also there are other illustrations that try to include graphical aspects but they don't explain what the pipe is about:
- https://revolution-computing.typepad.com/.a/6a010534b1db25970b01a3fd380b67970b-800wi
- http://garthtarr.github.io/visR/lectures/01/Z.jpg
Best wishes and thank you for sharing your illustrations