You signed in with another tab or window. Reload to refresh your session.You signed out in another tab or window. Reload to refresh your session.You switched accounts on another tab or window. Reload to refresh your session.Dismiss alert
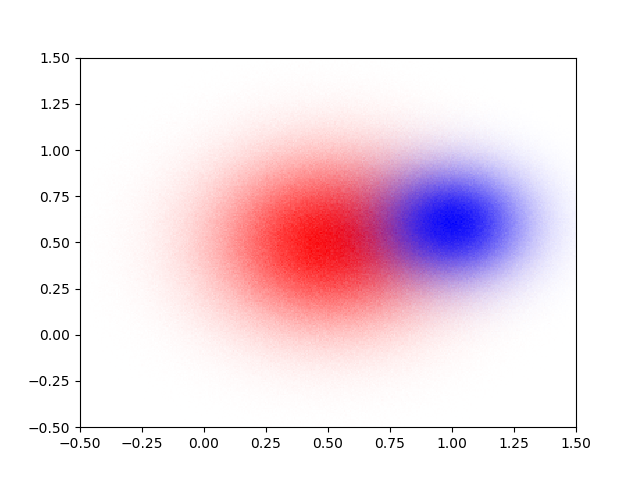
I was wondering how to interpret the colors when one is plotting multiple density maps together, does anyone know this? Say e.g. the example in the README:
How does one interpret the color in the middle? Is it possible to quantify the color by a color scale?
For example, if there are three blue dots in a pixel and two reds, does that make a purple pixel?
Thanks a lot!
Cheers,
The text was updated successfully, but these errors were encountered:
Hi all,
I was wondering how to interpret the colors when one is plotting multiple density maps together, does anyone know this? Say e.g. the example in the README:
How does one interpret the color in the middle? Is it possible to quantify the color by a color scale?
For example, if there are three blue dots in a pixel and two reds, does that make a purple pixel?
Thanks a lot!
Cheers,
The text was updated successfully, but these errors were encountered: