tags with values that contain complicated values are not escaped correctly #65
Description
given this configuration:
      {TelemetryMetricsStatsd,
       [
         formatter: :datadog,
         metrics: metrics(),
         # 512 bytes is the default, but including the SQL query is larger than that.
         mtu: 2048
       ]}

# ...
      summary("my_app.repo.query.query_time", tags: [:query], unit: {:native, :millisecond}),
The repo is an Ecto.Repo, using Ecto version 3.7.1 and EctoSQL 3.7.0. Here is where it emits the telemetry
emits this to statsd:
gostatsd1 | time="2021-10-12T19:07:24Z" level=info msg="stats.timers.my_app.repo.query.query_time. i0.\"column_one\". i0.\"data\". i0.\"inserted_at\". i0.\"updated_at\" FROM \"my_table\" AS i0. i0.\"user_id\".environment.development.host.st-dbern1.query.SELECT i0.\"id\".s.172.21.0.1.std 0.000000 1634065644"
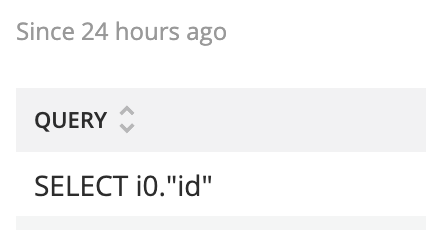
From here, it's interpreted incorrectly at a sink like NewRelic, where it looks like the tag :query was read as SELECT i0."id"
and the rest of the SQL is interpreted as "tags" incorrectly:
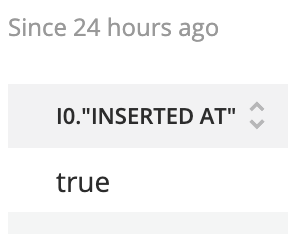
It appears that the values need to be escaped in a way for the entire SQL value to be taken all together.