Replies: 4 comments 2 replies
-
|
Hello, |
Beta Was this translation helpful? Give feedback.
-
|
Same issue here as well. |
Beta Was this translation helpful? Give feedback.
-
|
What is the value range in your data (x axis)? |
Beta Was this translation helpful? Give feedback.
-
|
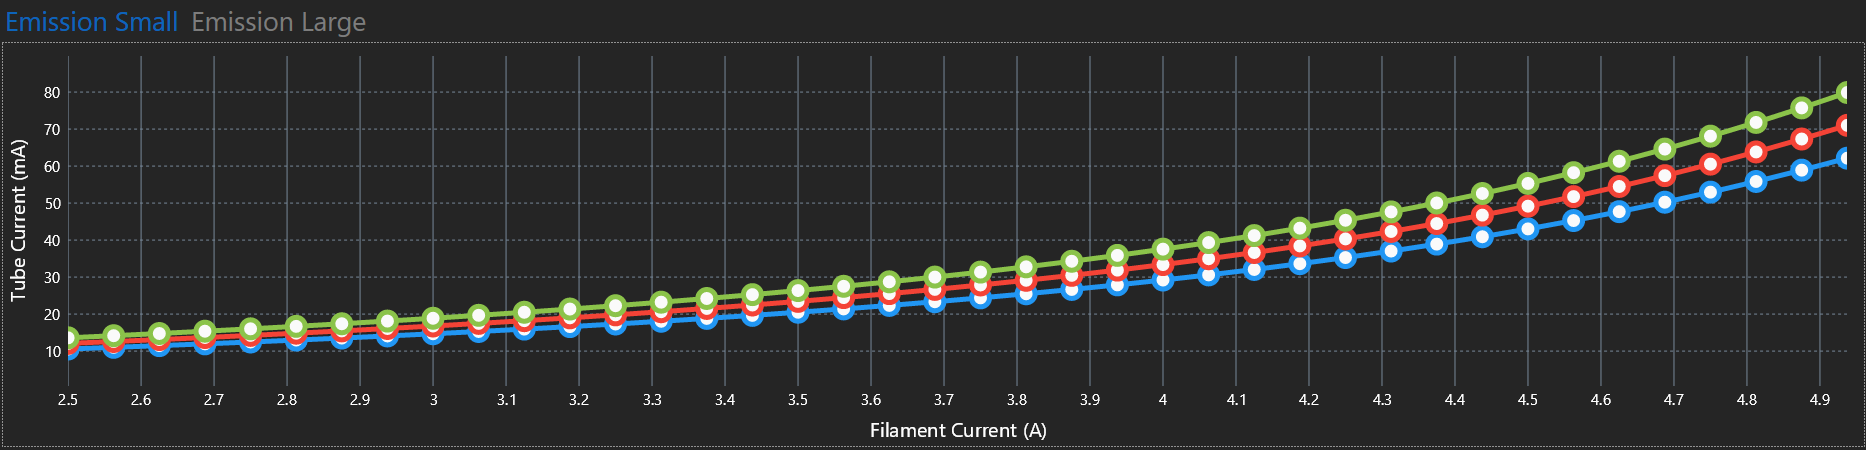
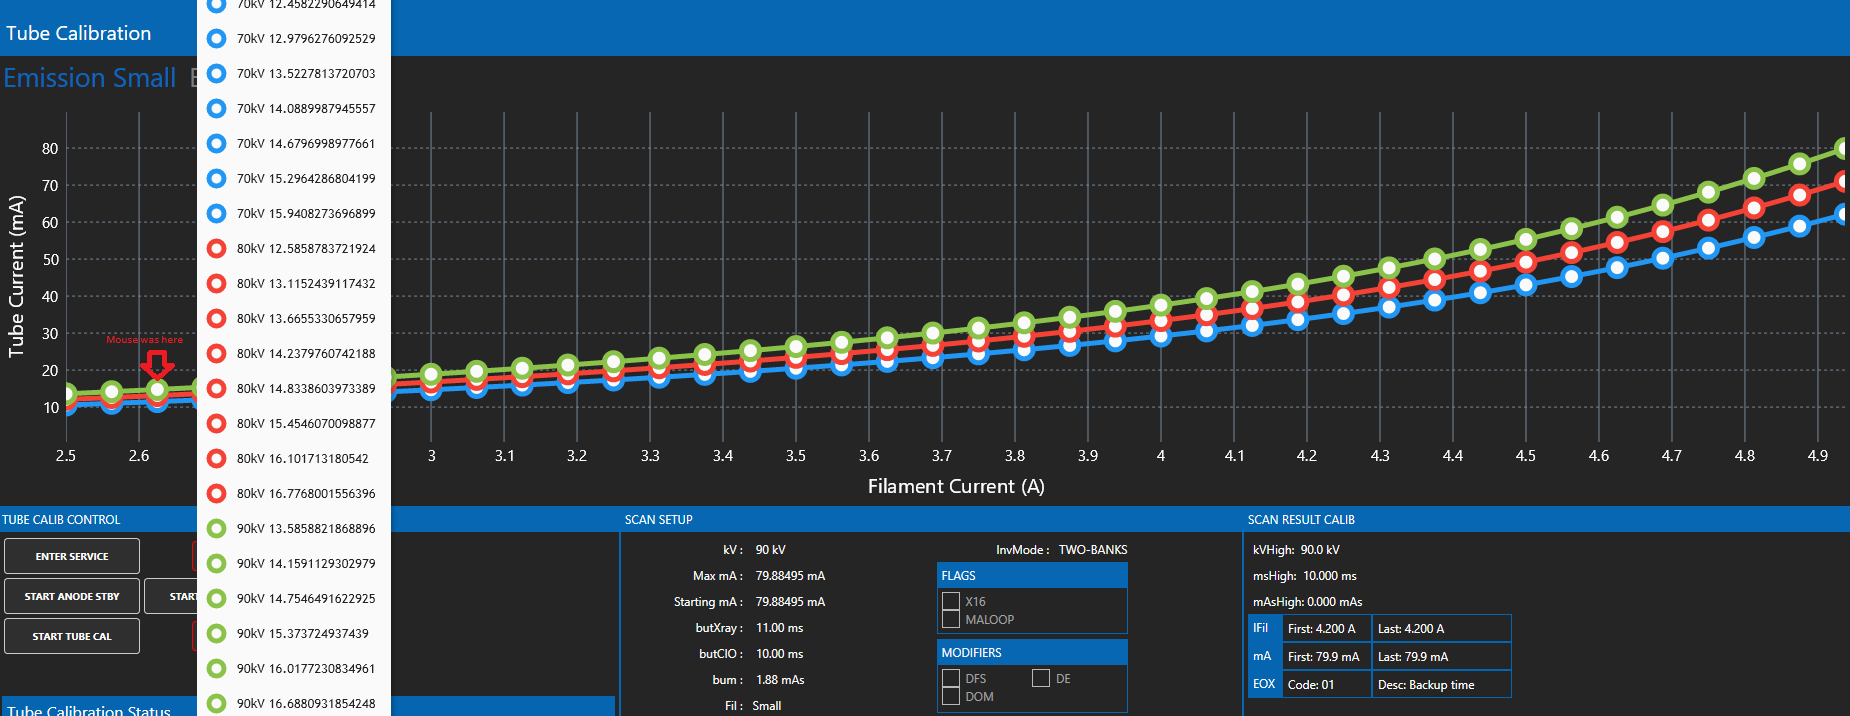
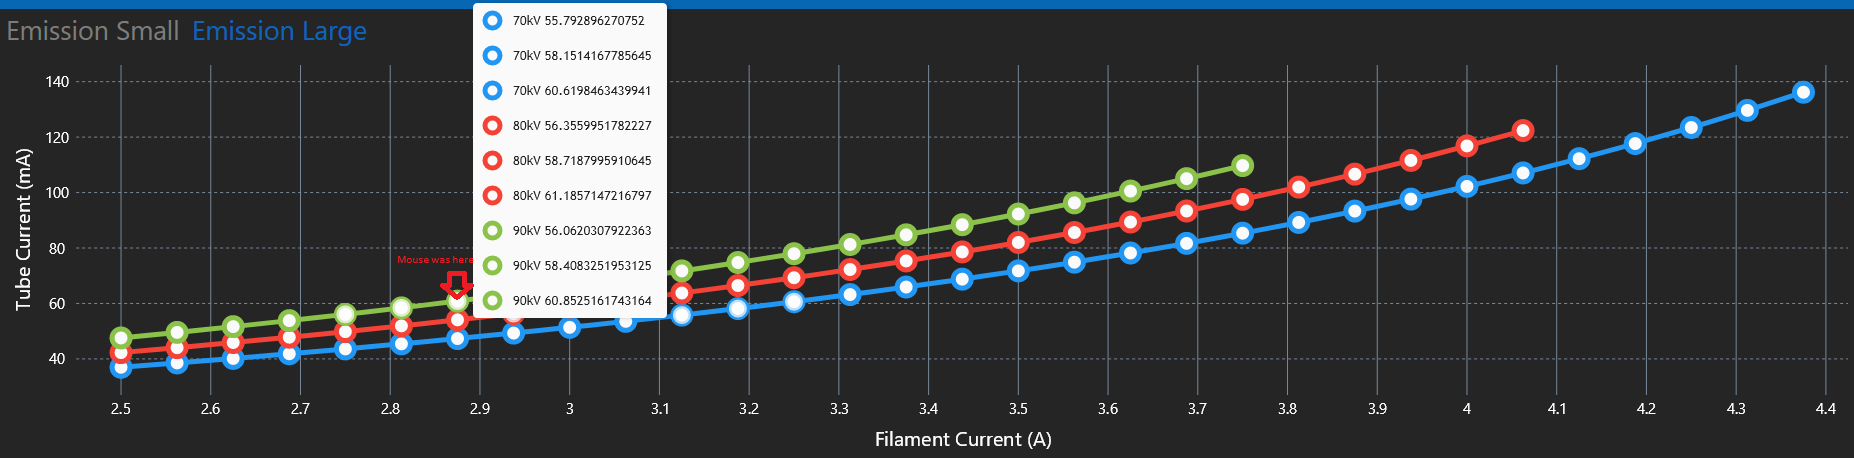
Hi, Here is an actual example :)
As you can see the tooltip shows me lots of points. I wouldn't mind that much if it was showing me all the Y points for the same X. (because in my case I have multiple Y points for the same X point). And btw, when I zoom, the tooltip is all over the place... It even sometimes show it on my second screen. |
Beta Was this translation helpful? Give feedback.
-
|
you need to try to change the Unit Width for the chart. As expected your values are <1 unit apart. Try changing the unit width to something like 0.1 to 0.08 for your case. will be somthing like Chart.XAxis[0].UnitWidth = 0.09; Hope that helps! I am not sure if this is technically correct but I think this is used as a kind of 'detection band' to determine the 'breadth' of values to show in the tooltip. I have had to develop an algorithm that TRIES to determine the UnitWidth based on '8 pixels'. To do this however I have had to make some assumptions as the pixel width of the 'data area' is not provided. Just the Width of the entire Cartesian plot. It is something like: ` Note that the VM.Get... functions run a method that collects the min and max values for each series displayed in my View Model. It is something you will need to alter/add for your own case. Its crude, but it seems to work ok for me. It is actioned when there is a zoom or the data is first drawn. It would be good if the next release provided
|
Beta Was this translation helpful? Give feedback.
-
|
Thank you so much! Yes, it works! I never thought about the unit width. My reason behind this was that if I configure the min and max to NULL (so it can autodetect the min and max) I assumed I don't need to worry about the unitwidth because I thought that the software can compute the unitwidth of the axis by applying the next formula by itself: unitwidth = (max - min) / numberOfPointsInOneSeries; (The series that has the most number of points) (I know it is not accurate... because you could have 2 points on the same X for example, but I guess it is better than assuming unitwidth always to 1). Your override function is even better than the simple formula I described above. I really like your approach on guesstimating the unitwidth. I am not complaining! I really like this library! If we can have a healthy discussion about on how to improve it a little bit why not do so? :) Thank you again! PS: I know it's not the thread for, but I observed that when I zoom it seems that the limiter factor on stop zooming is to have at least 6 drawn points of one series. Can I configure this limit of 6 drawn points to say 3 points or even 2 points instead so I can zoom a little bit further? |
Beta Was this translation helpful? Give feedback.
Uh oh!
There was an error while loading. Please reload this page.
-
For some reason when I enable tooltips it displays every value in the series and not the value I am hovering over. I have a few thousand points in my series, but even when I zoom down to a level where the data should be granular I still see all the values in my series in the tooltip.
this is my LineSeries
chan0Series = new LineSeries
{
Name = "Channel 0",
Values = this._observableValuesChan0,
Fill = null,
GeometryFill = null,
GeometryStroke = null,
Stroke = new SolidColorPaint(chan0Color) { StrokeThickness = 2 },
ScalesYAt = 0,
LineSmoothness = 0,
TooltipLabelFormatter = (chartPoint) => $"{chartPoint.PrimaryValue}"
};
and the xaml
<lvc:CartesianChart x:Name="lvcHistChart" ZoomMode="X" ZoomingSpeed=".5"
Series="{Binding Series}" XAxes="{Binding XAxes}" YAxes="{Binding YAxes}" TooltipPosition="Top"
LegendPosition="Right">
</lvc:CartesianChart>
Beta Was this translation helpful? Give feedback.
All reactions