Rather than relying on charting and visualization tools within a GIS software package, or the issues connecting proprietary software packages to each other with a hack, instead use LibreOffice to connect to your PostgreSQL (and thus PostGIS) data with the LibreOffice Base database connection tools.
LibreOffice is a free and open source office suite, similar to Microsoft Office. It contains word processing, spreadsheet, presentation, vector graphics and flowcharts, database, and math / formula tools.
As with most other open source tools, it is built to naturally connect to other open source software packages - in our case, we're going to use the libraries contained in LibreOffice Base to connect to PostgreSQL, which we can then use for charting and reporting of our spatial and non-spatial data.
Note: Ubuntu / Linux Mint users can install the PostgreSQL / LibreOffice SDBC libraries with this command:
sudo apt-get install libreoffice-sdbc-postgresql
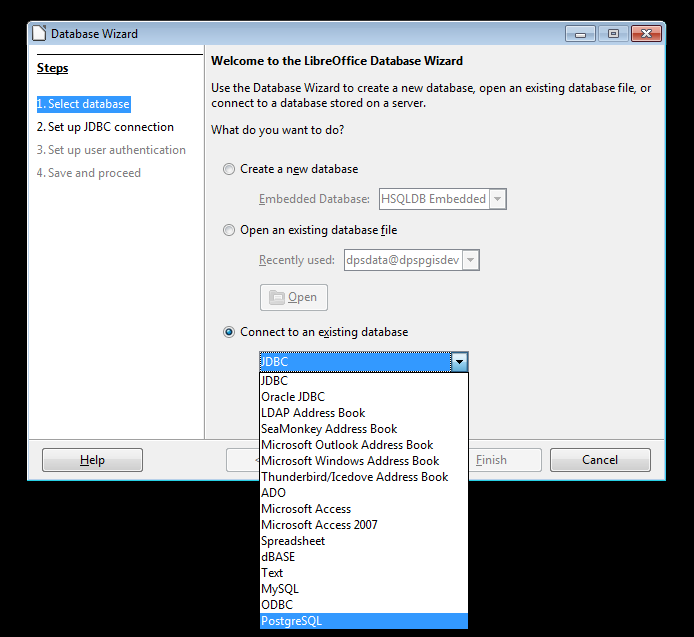
Launch LibreOffice Base and choose to connect to a new PostgreSQL database:
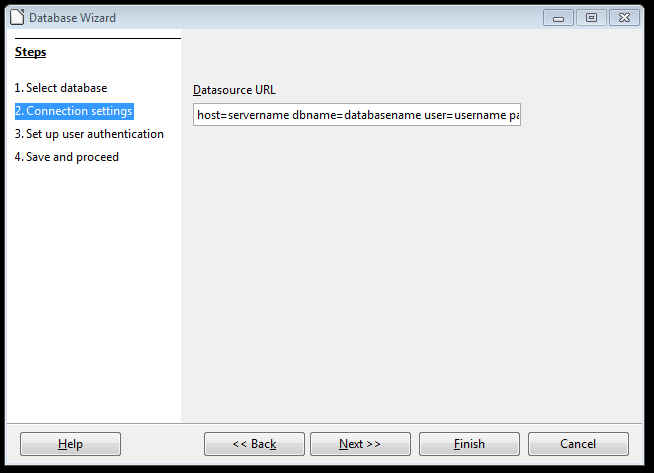
Now use the following string and syntax to connect to your PostgreSQL database:
host=servername dbname=databasename user=username password=******
Next, add your username if prompted, and test the connection if you want.
Also give your connection a name.
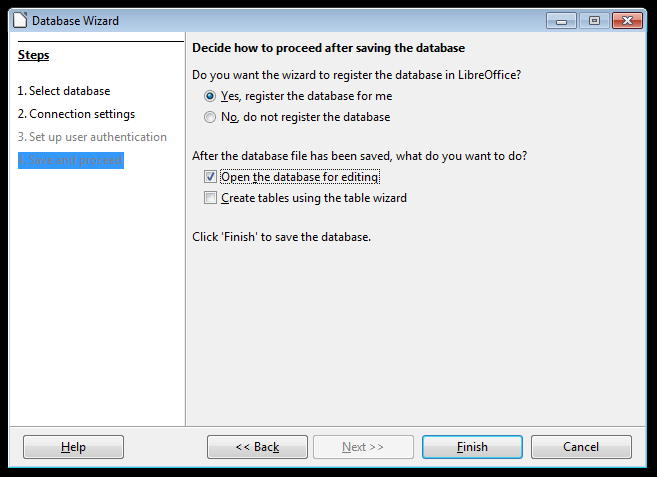
Now finish the connection to your database.
-
Choosing 'Yes, register the database for me' will let you save a connection file to your database, which you can use later on to access your PostgreSQL database in LibreOffice Calc, and to edit your non-spatial data.
-
Enabling 'Open the database for editing' will take you directly to your data in LibreOffice Base
-
Lastly, ensure you save your connection file in a place you can find it later.
You now have a connection to your PostgreSQL database registered with LibreOffice. You should have saved a file on disk that looks like this:
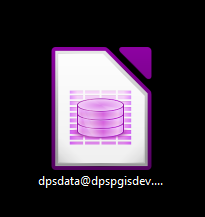
Double-click the connection to open your database in LibreOffice Base
Choose the Tables node to see your PostgreSQL data:

Double-clicking a table will give you access to the raw data - careful not to choose a table with complex polygon or linestring data, as loading the text representation will cause LibreOffice to hang.
For this example, I want to chart the number of students by grade in the NW Neighborhoods of Denver as defined by the City and County of Denver Statistical Neighborhoods dataset.
We store the students separate from the neighborhoods they live in, so I will spatially intersect the students from our internal spatial table of October Count students with the neighborhoods.
I'll then write the result to a table in my PostgreSQL database.
Here is the query:
create table temp_students_nhoods as (

select
oct.adjgradecrd as grade
, h.nbhd_name
, count(*)

from dpsdata."OctoberCount_Archive"  as oct
join ccd."CCD_Neighborhoods" as h on ST_Intersects(oct.geom, h.geom)

where oct.year = '2016'
and h.nbhd_id in ('11', '62', '36', '39', '75', '56', '8', '52')
group by oct.adjgradecrd, h.nbhd_name

)
And here is the result in PostgreSQL:
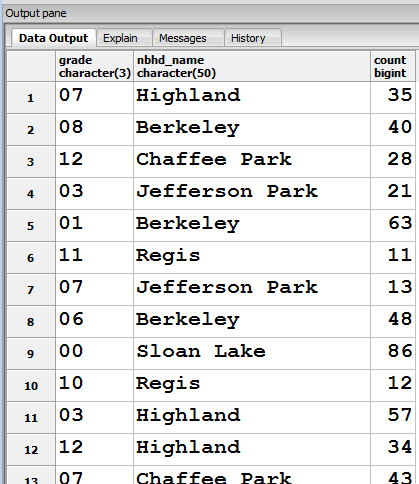
Now that the table lives in PostgreSQL, and we have registered the database with LibreOffice, we can open the LibreOffice Calc application and visualize the result.
Open LibreOffice Calc
From the View menu, enable Data Sources
You'll see your connection file, and you can expand to see the list of tables in your database.
Find the table created in SQL, and you can see the raw data on the right:

The data is almost in the format we need - we just need to group the grade counts by neighborhood. This could be done in SQL, but since we're going to make a chart in Calc, we can also make a pivot table of the data straight from the database.
From the Data menu, access Pivot Table > Create
For the Source, choose the Data source registered in LibreOffice option.
Then choose the database connection, the Table type option, and scroll down to the table:
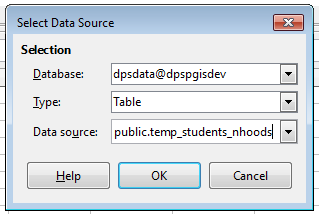
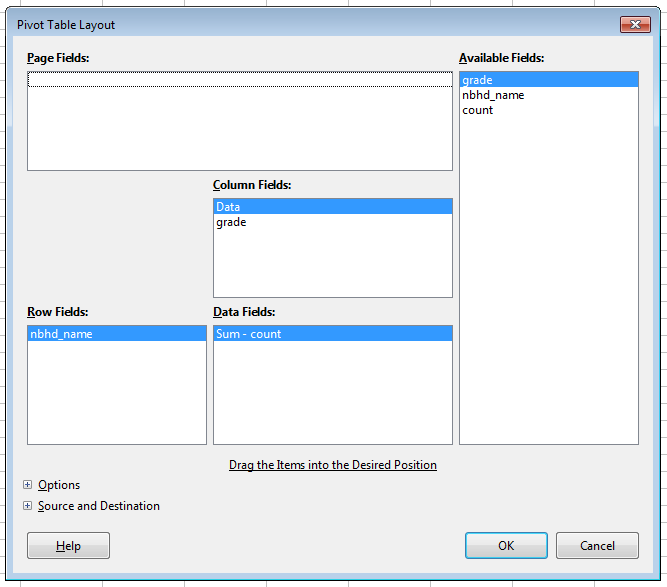
Click OK, and the Pivot Table layout will pop up.
Here the defaults will get us what we need, using the nbhd_name as the Row Field, grade as the Column field, and count (sum) as the Data Field:
And the result pivot table data:
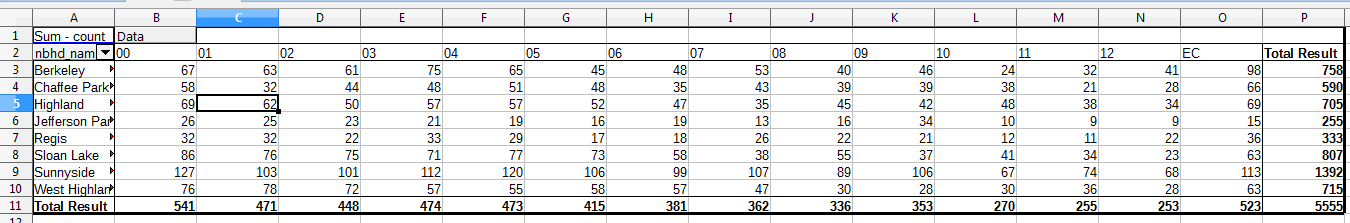
Now we need only select the relevant data from the pivot table (ie. not the Total Results row/columns), and click the Insert Chart button and we can create a basic stacked bar graph of the data (with a few minor tweaks):
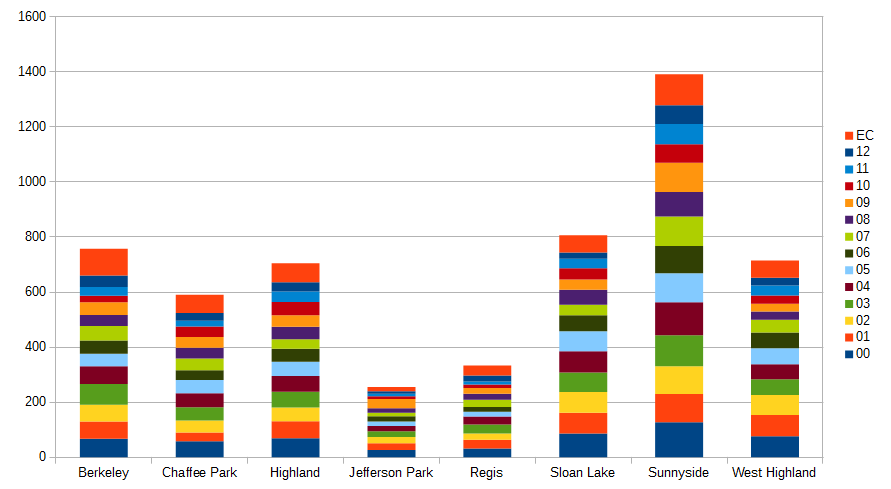
This is a very simple example but proves an effective use of complementary open source technologies to get the job done. Spatial data shouldn't be forced to only live on a map, nor should it only be visualized with tools within a GIS interface.
This example also shows the dynamic charting of data in PostgreSQL - we haven't made any changes to the underlying data here, but if, for example, you made edits to data in QGIS or to other tabular values, the pivot table can be refreshed to show the results of any query that combines the input data!