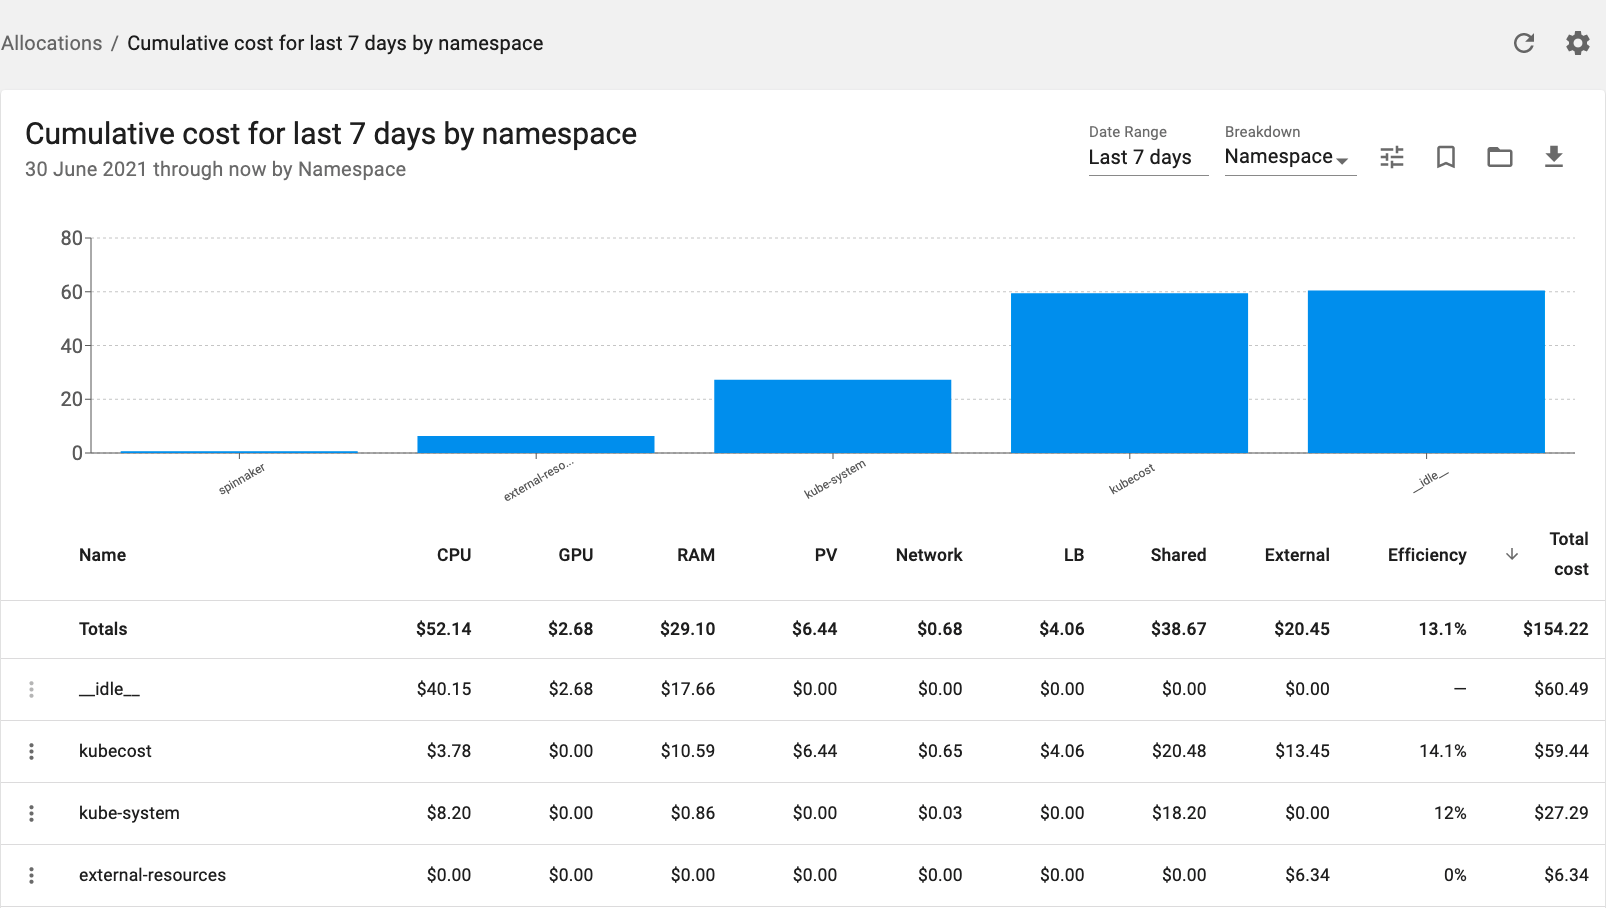
The Kubecost Allocation view allows you to quickly see allocated spend across all native Kubernetes concepts, e.g. namespace, k8s label, and service. It also allows for allocating cost to organizational concepts like team, product/project, department, or environment. This document explains the metrics presented and describes how you can control the data displayed in this view.
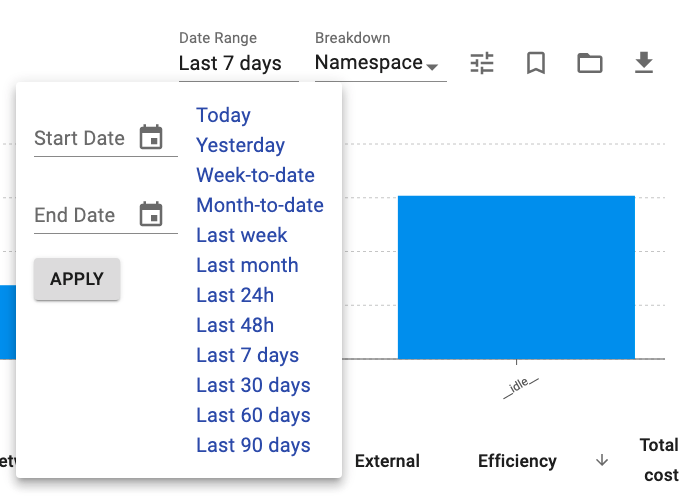
Select the Date Range of the report, using common Date Range options or by setting specific start and end dates.
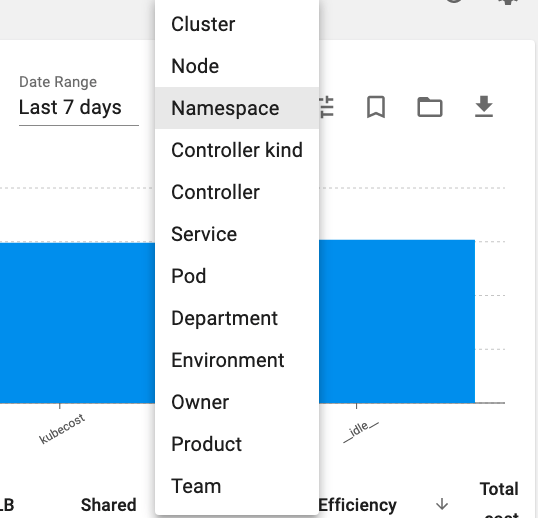
Aggregate cost by namespace, deployment, service, and other native Kubernetes concepts.
Costs aggregations are also visible by other meaningful organizational concepts, e.g. Team, Department, and Product. These aggregations are based on Kubernetes labels, referenced at both the pod and namespace-level, with labels at the pod-level being favored over the namespace label when both are present. The Kubernetes label name used for these concepts can be configured in Settings or in values.yaml after setting kubecostProductConfigs.labelMappingConfigs.enabled to true. Workloads without the relevant label will be shown as __unallocated__.
Kubernetes annotations can also be used for cost allocation purposes but this requires enabling a helm flag. Learn more about using annotations
To find what pods are not part of the relevant label set... you can either apply an __unallocated__ label filter in this allocation view or explore variations of the following kubectl commands:
kubectl get pods -l 'app notin (prometheus, cost-analyzer, ...)' --all-namespaces
kubectl get pods --show-labels -n <TARGET_NAMESPACE>
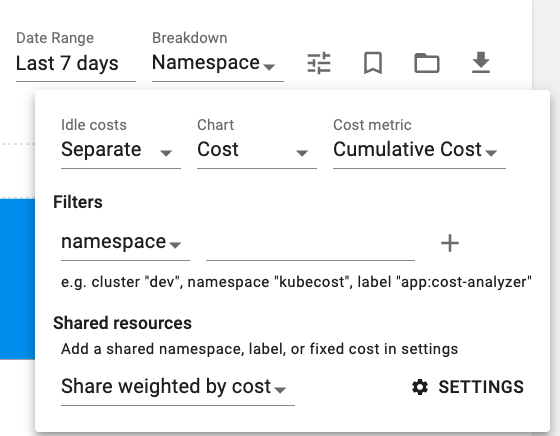
Allocating idle costs proportionately distributes slack or idle cluster costs to tenants. Specifically, this applies to resources that are provisioned but not being fully used or requested by a tenant. As an example, if your cluster is only 25% utilized, as measured by the max of resource usage and requests, applying idle costs would proportionately increase the cost of each pod/namespace/deployment by 4x. This feature can be enabled by default in Settings.
View Allocation data in the following formats:
- Cost: Total cost per aggregation over Date Range
- Cost over time: Cost per aggregation broken down over days or hours depending on Date Range
- Proportional Cost: Cost per aggregate displayed as a percentage of total cost over Date Range
View either cumulative or run rate costs measured over the selected time window based on the resources allocated.
- Cumulative Costs -- represents the actual/historical spend captured by the Kubecost agent over the selected time window
- Rate metrics -- hourly, daily, or monthly "run rate" cost, also used for projected cost figures, based on samples in the selected time window
Costs allocations are based on the following:
- resources allocated, i.e. max of resource requests and usage
- the cost of each resource
- the amount of time resources were provisioned
For more information, refer to this FAQ on how each of these inputs is determined based on your environment.
Filter resources by namespace, clusterId, and Kubernetes label to more closely investigate a rise in spend or key cost drivers at different aggregations, e.g. Deployments or Pods. When a filter is applied, only resources with this matching value will be shown. These filters are also applied to external out-of-cluster asset tags. Supported filters are as follows:
| Fitler | Description |
|---|---|
| Namespace | Limit results to workloads in a set of namespaces. |
| ClusterID | Limit results to workloads in a set of clusters with matching IDs. Note: clusterID is passed in values at install-time. |
| Label | Limit results to workloads with matching Kubernetes labels. Namespace labels are applied to all of its workloads. Supports filtering by __unallocated__ field as well |
| Pod Prefix | Limit results to workloads that begin with this string. |
Comma-separated lists are supported to filter by multiple categories, e.g. namespace filter equals kube-system,kubecost
Select how shared costs set on the settings page will be shared among allocations
Use these icons to save report settings or load reports that you have saved in the past. You can also download a report in CSV format.
Cost allocation metrics are available for both in-cluster and out-of-cluster resources. Here are short descriptions of each metric:
| Metric | Description |
|---|---|
| Memory cost | The total cost of memory allocated to this object, e.g. namespace or deployment. The amount of memory allocation is equal to the maximum of memory used and memory requested over the measured time window. The price of allocated memory is based on cloud billing APIs or custom pricing sheets. Learn more |
| CPU Cost | The total cost of CPU allocated to this object, e.g. namespace or deployment. The amount of CPU allocated is the greater of CPU usage and CPU requested over the measured time window. The price of the allocated CPU is based on cloud billing APIs or custom pricing sheets. Learn more |
| Cost Efficiency | The percentage of requested CPU & memory dollars utilized over the measured time window. Values range from 0 to above 100 percent. Workloads with no requests but with usage OR workloads with usage > request can report efficiency above 100%. View Example |
| Network Cost | The cost of network traffic based on internet egress, cross-zone egress, and other billed transfer. Note: these costs must be enabled. Learn more |
| PV Cost | The cost of persistent storage volumes claimed by this object. Prices are based on cloud billing prices or custom pricing sheets for on-prem deployments. |
| GPU Cost | The cost of GPUs requested by this object, as measured by resource limits. Prices are based on cloud billing prices or custom pricing sheets for on-prem deployments. |
| Shared Cost | The cost of shared resources allocated to this tenant. This field covers shared overhead, shared namespaces, and shared labels. |
| External Cost | The cost of out-of-cluster resources allocated to this object. For example, S3 buckets allocated to a particular Kubernetes deployment. Prices are based on cloud billing data and require a key. This feature is currently available for AWS (learn more), GCP (learn more) and Azure (learn more). |
| Metric | Description |
|---|---|
| Memory cost | The total cost of memory allocated to this object, e.g. namespace or deployment. The amount of memory allocated is the greater of memory usage and memory requested over the measured time window. The price of allocated memory is based on cloud billing APIs or custom pricing sheets. Learn more |
| CPU Cost | The total cost of CPU allocated to this object, e.g. namespace or deployment. The amount of CPU allocated is the greater of CPU usage and CPU requested over the measured time window. The price of allocated CPU is based on cloud billing APIs or custom pricing sheets. Learn more |
| Cost Efficiency | The percentage of requested CPU & memory dollars utilizated over the measured time window. Values range from 0 to above 100 percent. Workloads with no requests but with usage OR workloads with usage > request can report efficiency above 100%. View Example |
| Network Cost | The cost of network traffic based on internet egress, cross-zone egress, and other billed transfer. Note: these costs must be enabled. Learn more |
| PV Cost | The cost of persistent storage volumes claimed by this object. Prices are based on cloud billing prices or custom pricing sheets for on-prem deployments. |
| GPU Cost | The cost of GPUs requested by this object, as measured by resource limits. Prices are based on cloud billing prices or custom pricing sheets for on-prem deployments. |
| Shared Cost | The cost of shared resources allocated to this tenant. This field covers shared overhead, shared namespaces, and shared labels. |
| External Cost | The cost of out-of-cluster resources allocated to this object. For example, S3 buckets allocated to a particular Kubernetes deployment. Prices are based on cloud billing data and require a key. This feature is currently available for AWS (learn more), GCP (learn more) and Azure (learn more). |
Edit this doc on Github


