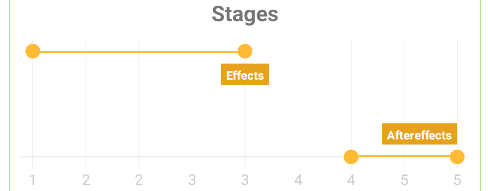
I'm using the following command to create a x-axis between 0 and e€{x.0; x.5}. ``` chartData.setAxisXBottom(Axis.generateAxisFromRange(0f, xEndLineAftereffect, 0.5f) .setName(context.getString(R.string.chart_stages_axisunit)) .setHasLines(hasLines) ); ``` But it doesn't print the axis like 1, 1.5, ... instead of it prints 1, 2, 2, like you can see on the screenshot below.  I'm not sure, whether I'm making something wrong or whether it is a bug? Best regards, xXSkyWalkerXx1