Releases: percona/pmm
Release v3.4.1
Percona Monitoring and Management 3.4.1
Release date: October 13, 2025
Percona Monitoring and Management (PMM) is an open source database monitoring, management, and observability solution for MySQL, PostgreSQL, and MongoDB. PMM empowers you to:
- monitor the health and performance of your database systems
- identify patterns and trends in database behavior
- diagnose and resolve issues faster with actionable insights
- manage databases across on-premises, cloud, and hybrid environments
🆕 Release summary
PMM 3.4.1 is a maintenance release that addresses several security vulnerabilities and dependency upgrades to enhance stability and security.
🔒 Security updates
Nomad Denial-of-Service (DOS) vulnerability (CVE-2025-8959)
PMM includes Nomad, which is currently affected by a high-severity DoS vulnerability originating from Go crypto library.
The risk is minimal for typical PMM deployments because Nomad is disabled by default.
We strongly recommend keeping Nomad disabled to prevent exposure.
We've upgraded Nomad to v1.10.5 and continue monitoring the upstream project. Once a fully patched version becomes available, we will include the fix in an upcoming PMM release.
Fixed: DoS in Percona Toolkit (Logrus)
Upgraded Percona Toolkit to v3.7.0-2 to resolve a high-severity DoS vulnerability in the github.com/sirupsen/logrus dependency. This flaw could previously crash Percona Toolkit commands, disrupting PMM data collection.
False-positive reported CVEs (PMM not affected)
Security scanning tools may flag the following CVEs. After a thorough review, we have confirmed that PMM 3.4.1 is not affected by these vulnerabilities.
OpenSSL cipher processing (CVE-2023-5363)
PMM is not affected by this vulnerability.
The openssl-libs package included in PMM's Oracle Linux 9 base operating system already contains the necessary security fix for this OpenSSL cipher processing issue. You can verify this in Oracle's official security advisory ELSA-2024-0627.
Remote code execution in Python Setuptools (CVE-2024-6345)
PMM is not affected by this vulnerability.
The PMM image's base OS, Oracle Linux 9, ships with python3-setuptools version 53.0.0-13.el9_6.1, which already includes the fix that addresses this vulnerability. You can confirm this through Oracle's security advisory ELSA-2024-5534.
ClickHouse vulnerabilities related to outdated Go runtime (CVE-2024-24790)
PMM is not affected by this vulnerability.
This vulnerability was discovered in ClickHouse version 23.8.2.7, the database engine that PMM uses for storing performance metrics. The vulnerability stems from an older version of Go (1.19.10) that was used to compile ClickHouse components.
The vulnerability specifically affects the clickhouse-diagnostics utility, which is a diagnostic tool that PMM does not use in its operations. To completely eliminate any potential exposure, we have removed the clickhouse-diagnostics package entirely from PMM 3.4.1.
We are planning a ClickHouse version upgrade for PMM 3.5.0, which will include an updated Go runtime and bring additional performance improvements and security enhancements.
Accepted risk: OpenSSL buffer overflow vulnerabilities (CVE-2022-3786 and CVE-2022-3602)
These vulnerabilities affect the openssl-libs package that comes with PMM's Oracle Linux 9 base image.
Oracle has released patches for these vulnerabilities, but they are distributed exclusively through Ksplice, Oracle's live patching service, available only to customers with Premier Support.
Because PMM uses only publicly available repositories, we cannot include these Ksplice-only updates in the current release.
We assess this risk as low, as PMM is usually deployed in controlled environments. We will apply the updates as soon as Oracle releases them publicly for Oracle Linux.
🚀 Ready to upgrade to PMM 3.4.1?
- New installation: Install PMM with our quickstart guide
- Upgrading from PMM 2: Migrate from PMM 2 to PMM 3
- Upgrading PMM 3: Upgrade your existing PMM 3 installation
❓ Questions or issues?
Visit our community forum or open an issue on GitHub.
Release v3.4.0
Percona Monitoring and Management 3.4.0
Release date: September 15th 2025
Percona Monitoring and Management (PMM) is an open source database monitoring, management, and observability solution for MySQL, PostgreSQL, and MongoDB. PMM empowers you to:
- monitor the health and performance of your database systems
- identify patterns and trends in database behavior
- diagnose and resolve issues faster with actionable insights
- manage databases across on-premises, cloud, and hybrid environments
Release summary
This release improves enterprise deployments and monitoring reliability, including better OpenShift support and centralized vmagent management. It also enhances RDS tracking, adds RHEL 10 compatibility, and delivers key dashboard updates and bug fixes.
Release highlights
OpenShift support for PMM Server
Building on the existing OpenShift compatibility available for PMM Client, PMM 3.4.0 now extends full support to PMM Server as well. This means that you can seamlessly deploy both PMM Client and PMM Server in OpenShift environments.
While OpenShift 4.16 is fully tested and supported, other versions will likely work, but are not guaranteed.
To deploy PMM Server on OpenShift using the standard Percona Helm charts with platform-specific parameters, see the Install PMM Server on your Kubernetes cluster/OpenShift clusters.
Centralized vmagent settings for all clients
You can now centrally configure vmagent settings for all connected PMM Clients using environment variables.
Instead of configuring each client individually, set VMAGENT_* variables on the PMM Server to automatically apply vmagent settings across your entire monitoring infrastructure.
This is particularly useful for Kubernetes environments where the default 1GB disk usage per client can overwhelm shared storage. For example, setting VMAGENT_remoteWrite_maxDiskUsagePerURL=52428800 reduces disk usage to 50MB per client and applies to all connected clients without restarts.
For configuration options and examples, see Configure environment variables for PMM Server.
Support for MySQL Cleartext authentication
PMM now supports monitoring MySQL instances that require cleartext authentication, including those using PAM authentication plugins (auth_pam_compat) or other external authentication methods.
When adding MySQL instances that use PAM or external authentication plugins, include the allowCleartextPasswords=1 parameter in the DNS. For details, see Connect MySQL databases to PMM.
!!! caution "Security warning"
Cleartext authentication transmits passwords without encryption. Only use this option when the connection is secured with SSL/TLS or over a trusted network. This is typically required for authentication plugins like auth_pam_compat that need access to the actual password for external authentication.
Enhanced management of RDS instances
PMM now supports tracking RDS Instance IDs when adding Amazon RDS databases to monitoring, making it easier to correlate instances between PMM and the AWS console.
When adding RDS instances via Inventory > Add Service, the instance ID that you specify will now be persisted. This optional field helps you manage large RDS deployments by providing a clear reference between monitored instances in PMM and their corresponding resources in AWS.
Behind the scenes, we've added an instance_id column to the database and enhanced the /v1/management/services API endpoint to accept and return this information. Everything is backward compatible, so existing RDS instances continue working normally.
For technical details about API enhancements, see the API Release Notes.

RHEL 10 support for PMM Client
PMM Client now supports Red Hat Enterprise Linux 10 (RHEL 10), allowing you to monitor databases and systems on the latest RHEL release. You can install native PMM Client packages for RHEL 10 on both AMD64 and ARM64 architectures. For detailed installation instructions, see Install PMM Client with Package Manager.
For configuration options and examples, see Configure environment variables for PMM Server.
Support for MySQL Cleartext authentication
PMM now supports monitoring MySQL instances that require cleartext authentication, including those using PAM authentication plugins (auth_pam_compat) or other external authentication methods.
When adding MySQL instances that use PAM or external authentication plugins, include the allowCleartextPasswords=1 parameter in the DSN. For details, see Connect MySQL databases to PMM.
!!! caution "Security warning"
Cleartext authentication transmits passwords without encryption. Only use this option when the connection is secured with SSL/TLS or over a trusted network. This is typically required for authentication plugins like auth_pam_compat that need access to the actual password for external authentication.
VMware support removed
With this release, support for VMware-based PMM Server deployments is deprecated and will be fully removed in PMM 3.6.0 (expected January 2026).
PMM 3 is built on a fully containerized architecture across all platforms for stronger security, simplified upgrades, and tighter alignment with modern DevOps practices. VMware’s proprietary model and recent licensing changes no longer fit this direction, so we are focusing on open, container-native platforms instead.
Recommended alternatives
For a smoother migration and long-term support, we recommend moving to one of the following supported platforms:
- Docker/Podman: lightweight, container-native deployments designed for PMM 3
- Kubernetes/OpenShift: full cloud-native orchestration at scale
- Oracle VirtualBox: still supported for VM-style deployments, running the same containerized PMM architecture
For detailed steps, see Migrating PMM from VMware to alternative platforms.
Components upgrade
- PMM-14015: PMM now ships with Grafana 11.6.3 for enhanced security and improved performance.
Improvements
-
PMM-14194: Custom filter groups in Query Analytics (QAN) now correctly distinguish between intentional comments and quoted strings containing comment-like characters. Previously, queries with values like
street = '123 Main St # app=something'would incorrectly generate unwanted custom filters.Now, only genuine SQL comments such as
-- app='web', team='backend'create filter options in the PMM Query Analytics dashboard sidebar. This means that you get cleaner query categorization when comment parsing is enabled. -
PMM-14048: Reorganized MongoDB dashboards for better usability. The MongoDB PBM Details and PBM Backup Details dashboards are now available directly from the main navigation for easier access, while the MongoDB InMemory Details and MongoDB WiredTiger Details dashboards are now relocated to Other Dashboards.
-
PMM-13990: Improved MongoDB exporter performance by caching regular expression operations. Previously, the exporter repeatedly compiled the same regular expressions during metric collection, causing unnecessary CPU overhead. Now, these regex patterns are cached and reused, reducing the MongoDB exporter's CPU usage without affecting monitoring data quality.
-
PMM-11826: You can now configure
vmagentsettings on PMM Clients by settingVMAGENT_environment variables on the PMM Server. These variables automatically apply to all connected clients, allowing you to tune disk usage limits and other parameters centrally. -
PMM-14208: Added support for PMM Client on Red Hat Enterprise Linux 10 (RHEL 10) for both AMD64 and ARM64 architectures.
Fixed issues
-
PMM-14141: Fixed a critical issue where the MongoDB exporter would sometimes ignore connection timeouts. This prevented MongoDB Down alerts from triggering when MongoDB was unavailable. We've also improved the MongoDB down alert rule to work more reliably in timeout scenarios.
-
PMM-13885: You can now reliably enable and disable advisors on the Advisors > Advisor Insights page, as the toggle issue has been fixed.
Release v3.3.1
Percona Monitoring and Management 3.3.1
| Release date | July 30th, 2025 |
|---|---|
| Installation | Installing Percona Monitoring and Management |
| Upgrade | Migrate PMM 2 to PMM 3 |
Percona Monitoring and Management (PMM) is an open source database monitoring, management, and observability solution for MySQL, PostgreSQL, and MongoDB. PMM empowers you to:
- monitor the health and performance of your database systems
- identify patterns and trends in database behavior
- diagnose and resolve issues faster with actionable insights
- manage databases across on-premises, cloud, and hybrid environments
RCE vulnerability in PMM - Immediate action required
We have identified a critical Remote Command Execution (RCE) vulnerability affecting all PMM 2.x and PMM 3.x installations. This vulnerability allows users with CLI access to PMM Client nodes or those with admin-level privileges to exploit the API and execute unauthorized commands on registered nodes.
Affected installations
This vulnerability affects all PMM 2.x and 3.x deployments where PMM Client nodes are connected to the PMM Server. The security flaw originates from the pt-mysql-summary tool, a component of the Percona Toolkit that automatically collects MySQL system information and diagnostics from PMM Client installations.
| Affected deployments | Version | Notes |
|---|---|---|
| All PMM installations with connected PMM Client nodes | PMM 2.x and PMM 3.x | Remote Command Execution vulnerability through pt-mysql-summary tool deployed when setting up PMM Clients |
Remediation options
Note
Upgrade to PMM 3.3.1
This release directly fixes the vulnerability and enhances overall security in all PMM deployments. To upgrade:
1. Schedule a maintenance window to minimize disruption.
2. [Download the latest PMM release](https://www.percona.com/downloads).
3. [Upgrade PMM Server](https://docs.percona.com/percona-monitoring-and-management/3/pmm-upgrade/index.html), then [upgrade PMM Client](https://docs.percona.com/percona-monitoring-and-management/3/pmm-upgrade/upgrade_client.html).
4. Change all credentials for the services that PMM monitors, including database user accounts and any other credentials (e.g., API keys, SSH keys) PMM uses to connect to your infrastructure.
5. Thoroughly check access logs for any potential unauthorized access attempts or suspicious activity.
Note
If you cannot upgrade immediately
If you are unable to upgrade to PMM 3.3.1 immediately, implement one of the following temporary measures to reduce risk. These options do not eliminate the vulnerability entirely. Prioritize upgrading to PMM 3.3.1 as soon as possible.
1. Choose one of the following temporary mitigation options:

    - Make `pt-mysql-summary` script non-executable to keep the system information tool on disk but prevent it from being executed via the vulnerable path:

    ```sh
    sudo chmod -x /usr/local/percona/pmm/tools/pt-mysql-summary
    ```

    - Delete `pt-mysql-summary` to permanently remove the vulnerable tool from your system:

    ```sh
    sudo rm -f /usr/local/percona/pmm/tools/pt-mysql-summary
    ```
Warning
Dashboard impact
Both options impact the MySQL Instance Summary dashboard. Since pt-mysql-summary collects system information, disabling or removing this tool will remove CPU, memory, disk, and OS version information from the dashboard. Other performance metrics continue to be collected normally.
2. Change all credentials for the services that PMM monitors, including database user accounts and any other credentials (e.g., API keys, SSH keys) PMM uses to connect to your infrastructure.
3. Thoroughly check access logs for any potential unauthorized access attempts or suspicious activity.
Support & additional resources
We are available to assist you 24/7 if you need further clarification or assistance:
We will continue to provide updates as new information becomes available.
Release v3.3.0
Percona Monitoring and Management 3.3.0
| Release date | July 9th, 2025 |
|---|---|
| Installation | Installing Percona Monitoring and Management |
| Upgrade | Migrate PMM 2 to PMM 3 |
Percona Monitoring and Management (PMM) is an open source database monitoring, management, and observability solution for MySQL, PostgreSQL, and MongoDB. PMM empowers you to:
- monitor the health and performance of your database systems
- identify patterns and trends in database behavior
- diagnose and resolve issues faster with actionable insights
- manage databases across on-premises, cloud, and hybrid environments
Release summary
This release delivers advanced PostgreSQL monitoring with five new dashboards and replication support, resolves MongoDB connection pool issues with the new mongolog query source, and adds label-based access control to Query Analytics to meet enterprise security needs.
It's also removing support for Ubuntu 20.04 LTS following its end-of-life, and includes numerous bug fixes and performance improvements to enhance overall stability.
Release highlights
Enhanced PostgreSQL monitoring with replication support
PMM 3.3.0 transforms PostgreSQL monitoring with enhanced existing dashboards, five new production-ready dashboards, replication monitoring and a redesigned menu structure for easier navigation.
New PostgreSQL dashboards:
- Replication Overview: tracks replication lag and reveals primary-replica relationships in real-time
- Top Queries: identifies performance bottlenecks with advanced query analysis and customizable time-based filtering
- Checkpoints, Buffers and WAL Usage: monitors checkpoint performance and correlates I/O usage patterns
- Instances Overview Extended: delivers deep-dive performance analytics with advanced PostgreSQL metrics
- Patroni Details: monitors high-availability PostgreSQL clusters with cluster member status, replication health, and failover monitoring (promoted from experimental status)
Enhanced PostgreSQL dashboards:
- Instance Summary: updated with wraparound metrics and top 10 database size analysis
- PostgreSQL Instances Overview: improved organization and additional metrics
New capabilities:
- Transaction ID wraparound prevention with with wraparound metrics
- Custom metric collection for monitoring beyond standard PostgreSQL statistics
- Better dashboard grouping to quickly spot issues across your PostgreSQL infrastructure
- New organized left menu structure with dedicated High Availability (HA) section

Label-based access control for Query Analytics
Query Analytics (QAN) now supports label-based access control (LBAC). This allows admins to associate label visibility with a role limiting visibility into query data. Users see only the databases and services permitted by their roles, with filter options automatically restricted based on assigned labels.
This makes it easy to limit access by technology (e.g., MySQL-only), environment (e.g., production), or region, enhancing both security and clarity.
To test it, set up a PMM Server, connect MySQL and PostgreSQL databases, enable access control, and define roles using LBAC selectors.
MongoDB monitoring at scale with new log-based query source
PMM 3.3.0 introduces mongolog, a new way to collect MongoDB metrics. This feature helps prevent connection issues in large-scale environments by reading metrics directly from MongoDB log files instead of using database queries.
Traditionally, monitoring many MongoDB databases (100+) can lead to timeouts as monitoring queries compete for limited connections. mongolog avoids this by using zero database connections, delivering the same query analytics data without impacting your database's performance.
This log-based approach reads from existing MongoDB log files (similar to MySQL's slow query log monitoring) which may increase disk I/O. Use it as an alternative to the default profiler-based method.
In addition, mongolog provides unlimited database scalability and support for restricted environments like mongos routers where system.profile access is unavailable.
To enable mongolog, add --query-source=mongolog when registering MongoDB services. For setup instructions, see Connect MongoDB databases to PMM.
PMM 3.3.0 coming to AWS Marketplace
PMM 3.3.0 will soon be available for deployment through the AWS Marketplace, making it easier to deploy Percona Monitoring and Management in your AWS environment. You can expect:
- preconfigured AMI with optimized settings
- simple hourly pricing plus standard EC2 costs
- quick deployment with a few clicks directly from AWS Marketplace
Stay tuned for the official launch announcement!
Platform support changes and deprecations
Removed support for Ubuntu 20.04 LTS (Focal Fossa)
Ubuntu 20.04 LTS (Focal Fossa) reached its End of Life on May 31, 2025. Consequently, we no longer build PMM Client packages for this platform.
If your PMM Client is running on Ubuntu 20.04, upgrade your operating system to Ubuntu 22.04 LTS or a later version, and then reinstall PMM Client using the package version for your new Ubuntu release.
Existing installations on Ubuntu 20.04 will continue to work but we will not release further updates. Source packages (.sdeb) are now built on Ubuntu 22.04 instead of Ubuntu 20.04.
Improvements
- PMM-13970 - Added
--tls-skip-verifyflag forpmm-admin add external,pmm-admin add external-serverless, andpmm-admin add haproxycommands. This flag skips TLS certificate validation, enabling you to monitor services with self-signed certificates or IP-based endpoints that lack proper certificate SANs, including PostgreSQL Operator deployments with HAProxy. - PMM-14000, PMM-13861, PMM-13862, PMM-13863, PMM-13864, PMM-13865, PMM-13866, PMM-13867, PMM-13868 - Enhanced PostgreSQL monitoring with five new dashboards, improved existing dashboards, custom query support for specialized metrics, and a redesigned menu structure for better navigation.
- PMM-12548 - Added
mongologquery source for MongoDB that reads slow query logs from disk, eliminating connection pool exhaustion in environments with 100+ databases. - PMM-13596 - Improved access control for PMM Dump and PMM Logs by hiding these menu options for users without appropriate permissions. Non-admin users no longer see inaccessible links in the Help menu, preventing confusing 401 error messages.
- PMM-14059 - Improved the Mongos Routers graph in the MongoDB Sharded Cluster Summary dashboard to display individual router nodes with their status in hexagon format, providing consistency with Config Servers and shard displays instead of showing only a generic OK status.
- PMM-13786 - Upgraded PMM OVF specification to OVF 2.0 format for enhanced security (SHA256 hashing), better virtual hardware support, and improved cloud compatibility.
- PMM-13821 - Upgraded Go runtime to version 1.24.x for enhanced performance. This update includes the latest CVE fixes and improvements to maintain PMM's security.
Fixed issues
- PMM-14070 - The Top 5 Databases By Size chart was not displaying data due to an incorrect query configuration. The chart no...
v3.2.0
Percona Monitoring and Management 3.2.0
| Release date | May 29th, 2025 |
|---|---|
| Installation | Installing Percona Monitoring and Management |
| Upgrade | Migrate PMM 2 to PMM 3 |
Percona Monitoring and Management (PMM) is an open source database monitoring, management, and observability solution for MySQL, PostgreSQL, and MongoDB. PMM empowers you to:
- monitor the health and performance of your database systems
- identify patterns and trends in database behavior
- diagnose and resolve issues faster with actionable insights
- manage databases across on-premises, cloud, and hybrid environments
Release summary
PMM 3.2.0 comes with better support for Amazon Linux 2023 and MySQL 8.4 replication, an upgrade to Grafana 11.6, secure ClickHouse connections, a new backup dashboard for MongoDB and faster filtering for QAN. This is in addition to many bug fixes and performance improvements!
Release highlights
Native PMM Client support for Amazon Linux 2023
PMM 3.2.0 introduces official RPM package support for installing the PMM Client on Amazon Linux 2023. If you’ve been deploying PMM Client on AL2023 and relying on tarball-based installation workarounds, you no longer need to — you can now install the Client through native RPM packages.
The RPM support streamlines setup with AL2023, and gets you monitoring databases faster.
Enhanced MySQL 8.4 support
PMM 3.2.0 now offers complete support for MySQL 8.4. While PMM 3.0.0 included partial compatibility with Query Analytics (QAN) and basic dashboards, it couldn't track replication metrics. This was because MySQL 8.4 changed how it exposes replication metrics, shifting from traditional status variables to performance_schema tables.
With this release, we've upgraded the MySQL Exporter to version 0.17.2, to enable it to collect replication metrics from both legacy status variables and the new performance_schema tables. We've also reconfigured the MySQL Replication Summary dashboard to display these metrics properly regardless of their source.
This means that PMM can now provide complete replication monitoring across all supported MySQL versions (5.7, 8.0, and 8.4), including critical metrics like IO Thread status, SQL Thread status, and Replication Lag.
Grafana 11.6 update and upgrade path for external PostgreSQL users
PMM now ships with Grafana 11.6, which delivers enhanced visualization capabilities, a more efficient alerting workflow, and a wide range of improvements:
- Alert state history for reviewing historical changes in alert statuses over time. Full functionality requires Grafana Loki for log aggregation and specific Grafana configuration to enable centralized tracking and storage.
- Improved panel features and actions visualization for better dashboard interactivity
- Simplified alert creation with improved UI workflows
- Recording rules for creating pre-computed metrics to optimize dashboard performance
Dashboard improvements:
- Navigation bookmarks for quick access to frequently used dashboards
- State timeline supports pagination for better performance with large datasets
- Centralized alert history page for managing all alert rules
- Improved Grafana Scenes support for modern dashboard architecture
Warning
Upgrading to PMM 3.2.0 with an external PostgreSQL database
If you're using an external PostgreSQL database, make sure to update your PMM Server configuration before upgrading to PMM 3.2.0. This is because Grafana 11.6 has a regression issue where the GF_DATABASE_URL environment variable is no longer sufficient for database configuration. See Migrate External PostgreSQL Configuration for PMM 3.2.0+ for step-by-step instructions.
Secure external ClickHouse connections
PMM now supports connecting to external ClickHouse servers using authenticated credentials.
You can now set the PMM_CLICKHOUSE_USER and PMM_CLICKHOUSE_PASSWORD environment variables when deploying PMM Server to enable access to password-protected ClickHouse instances, such as those managed by Altinity’s operator.
This means that previous authentication errors are resolved, you no longer need to embed credentials in connection strings, which makes your setup more secure.
Feature Compatibility Version (FCV) panel in MongoDB dashboards
PMM now shows the current MongoDB Feature Compatibility Version (FCV) in the MongoDB Replica Set and MongoDB Sharded Cluster Summary dashboards.
This panel helps you quickly see if your cluster is running the expected FCV—especially after upgrades, when the FCV might not match the MongoDB version yet.

New PBM Details dashboard for MongoDB backups
PMM now includes a new MongoDB PBM Details dashboard that enables you to monitor MongoDB backups directly from PMM. This new dashboard is powered by the PBM collector and offers a unified, real-time view of all your backup activity across replica sets and sharded clusters.
It displays key information such as backup status, configuration, size, duration, PITR status, and details of the most recent successful backup—all in one place.
If you're already using Percona Backup for MongoDB (PBM) with PMM, this integration lets you track backup operations without switching between tools.
To get started, open the PBM Details dashboard and see how it works with your MongoDB environments.

Future releases will improve the Backup history panel to better display certain error states and special conditions (like stuck or incompatible backups) that are currently only visible when using PBM's pbm status command directly.
Improved Query Analytics filter performance
We've optimized QAN filter loading performance to reduce the number of processed rows by up to 95% in large environments. This means that the filters on the PMM Query Analytics page now load faster, which makes the interface more responsive.

Nomad integration for future extensibility
We've integrated HashiCorp Nomad into PMM to lay the groundwork for future feature development. This workload orchestrator will initially manage monitoring agents to improve service delivery for Percona customers.
If you are an advanced user, you can access the Nomad API (internal port 4646) through the standard PMM HTTPS port by appending /nomad to your PMM Server URL. The full API path is https://<pmm-server>/nomad/v1/. You must have Administrator rights to access this endpoint.
Nomad is disabled by default. Even though it increases the overall Docker image size, it has no performance impact when not enabled. For more information, see Nomad configuration.
Improvements
-
PMM-13453 - Improved how PMM checks for updates. Automatic checks now use cached information to reduce system load, while clicking Check for updates on the Updates page performs a thorough check for the latest versions.
This ensures you get the most accurate information when explicitly checking for updates, while improving overall system performance.
-
PMM-13644 - Added a default 30-day retention policy for ClickHouse system log tables (
trace_log,metric_log,query_log). This default policy keeps recent logs readily available for troubleshooting but prevents potential ClickHouse performance issues that excessive log data could cause.You can customize the retention by updating the Time-To-Live (TTL) expression (
event_date + INTERVAL X DAY DELETE) in the ClickHouse configuration. -
PMM-13869 - PMM now outputs Nginx access logs in LOGFMT format, ensuring consistency across all PMM components. This also imp...
v2.44.1
Percona Monitoring and Management 2.44.1
| Release date | April 24, 2025 |
|---|---|
| Installation | - Install Percona Monitoring and Management 2 - Install Percona Monitoring and Management 3 |
Percona Monitoring and Management (PMM) is an open source database monitoring, management, and observability solution for MySQL, PostgreSQL, and MongoDB.
It enables you to observe the health of your database systems, explore new patterns in their behavior, troubleshoot them, and execute database management operations regardless of whether your databases are located on-premises or in the cloud.
Release summary
PMM 2.44.1 is a maintenance release that improves MongoDB monitoring reliability and addresses security vulnerabilities through updated Docker images.
What's new
PMM v3 migration notice
When you launch PMM 2, you’ll now see a notification prompting you to migrate to PMM v3, as PMM 2 is no longer actively developed. Since the release of PMM 3 in January 2025, PMM 2 in maintenance phase, receiving only Critical and High CVE fixes until July 30, 2025. For continued support and to access all future improvements, we strongly recommend upgrading to PMM 3 now.
Moving to PMM v3 provides significantly enhanced security, improved stability, and an overall smoother user experience. You will now be presented with a direct link to the migration documentation to help guide you through the process.
Fixed visibility of offline MongoDB replica set nodes
Fixed a monitoring gap in the MongoDB ReplSet Summary dashboard, where nodes in a Down state occasionally disappeared from the States panel.
Offline now remain consistently visible in both panels with a clear Down status (highlighted in red).
CVE fixes
Fixed CVE-2023-45288, a Server-Side Request Forgery (SSRF) vulnerability, by updating the golang.org/x/net/http/httpproxy package to version 0.36.0 across multiple components in the PMM Client Docker image.
This prevents potential attacks that could bypass proxy restrictions and strengthens overall security.
v3.1.0
Percona Monitoring and Management 3.1.0
| Release date | March 31th, 2025 |
|---|---|
| Installation | Installing Percona Monitoring and Management |
| Upgrade | Migrate PMM 2 to PMM 3 |
Percona Monitoring and Management (PMM) is an open source database monitoring, management, and observability solution for MySQL, PostgreSQL, and MongoDB.
PMM empowers you to:
- monitor the health and performance of your database systems
- identify patterns and trends in database behavior
- troubleshoot issues effectively
- execute database management tasks seamlessly, whether your databases are on-premises or in the cloud
Release summary
PMM 3.1.0 enhances MongoDB monitoring with improved query analytics, better visualization, and streamlined troubleshooting. This release also refines role-based access for advisors and alerts, along with various usability improvements and bug fixes.
Release highlights
Enhanced MongoDB monitoring
We've improved MongoDB monitoring with detailed query metrics, better dashboard visualization, and new capabilities to quickly identify performance bottlenecks.
Extended metrics and labels for MongoDB Query Analytics (QAN)
The QAN dashboard includes new metrics and filters that highlight inefficient execution paths and offer detailed lock and storage metrics. With the improved filters, you can quickly pinpoint problematic queries based on application, client, user, or plan summary:
New metrics
In the Query Details section of the QAN dashboard you'll now find these additional metrics:
=== "Query execution metrics"
New metrics for identifying inefficient query patterns:
- **Docs Examined**: the number of documents scanned. High values may indicate missing or inefficient indexes.
- **Keys Examined**: the number of index keys scanned. Compare this with **Docs Examined** to assess index efficiency.
- **Docs Returned**: the number of documents returned to the PMM Client. A high **Docs Examined** to **Docs Returned** ratio may indicate inefficiencies that need optimization.
- **Full Scan (COLLSCAN)**: tracks instances where the entire dataset is scanned, meaning every document in the collection is read. This results in high I/O operations, long execution times, and scalability challenges. High COLLSCAN should be addressed to enhance performance.
=== "Response metric"
New metric for evaluating query response efficiency:
**Response Length**: measures the size of the response payload in bytes, helping identify large result sets that may impact performance.
=== "Lock statistics metrics"
New metrics for detecting lock contention issues:
- **Locks Global Acquire Count Read/Write Shared**: tracks how often global locks are used, helping to spot delays caused by multiple processes accessing the same data.
- **Locks Database Acquire Count Read Shared**: tracks how often read locks are used in the database.
- **Locks Database Acquire Wait Count Read Shared**: counts the times a database read lock request had to wait. High values may signal delays due to contention.
- **Locks Database Time Acquiring Micros Read Shared**: captures the time spent waiting for database read locks, critical for performance analysis.
- **Locks Collection Acquire Count Read Shared**: tracks how often read locks are used at the collection level.
=== "Storage metrics"
New metrics for analyzing I/O performance:
- **Storage Bytes Read**: measures the volume of data read from storage during operations, helping identify I/O-intensive queries.
- **Storage Time Reading in Microseconds (µs)**: tracks the time spent on storage read operations, which is useful for detecting potential storage bottlenecks.
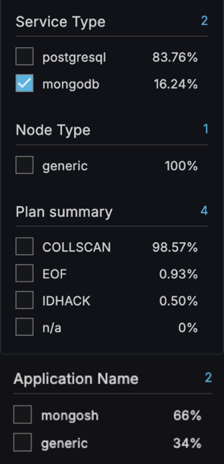
New filters
The QAN dashboard now includes several additional MongoDB-specific filter options:
-
Plan Summary: filters queries by execution plan type (COLLSCAN, IXSCAN, etc.) to easily identify inefficient full collection scans.
-
Application Name: filters queries by the application that executed them.
-
User: isolates queries by specific database users.
-
Database: focuses on particular database instances.
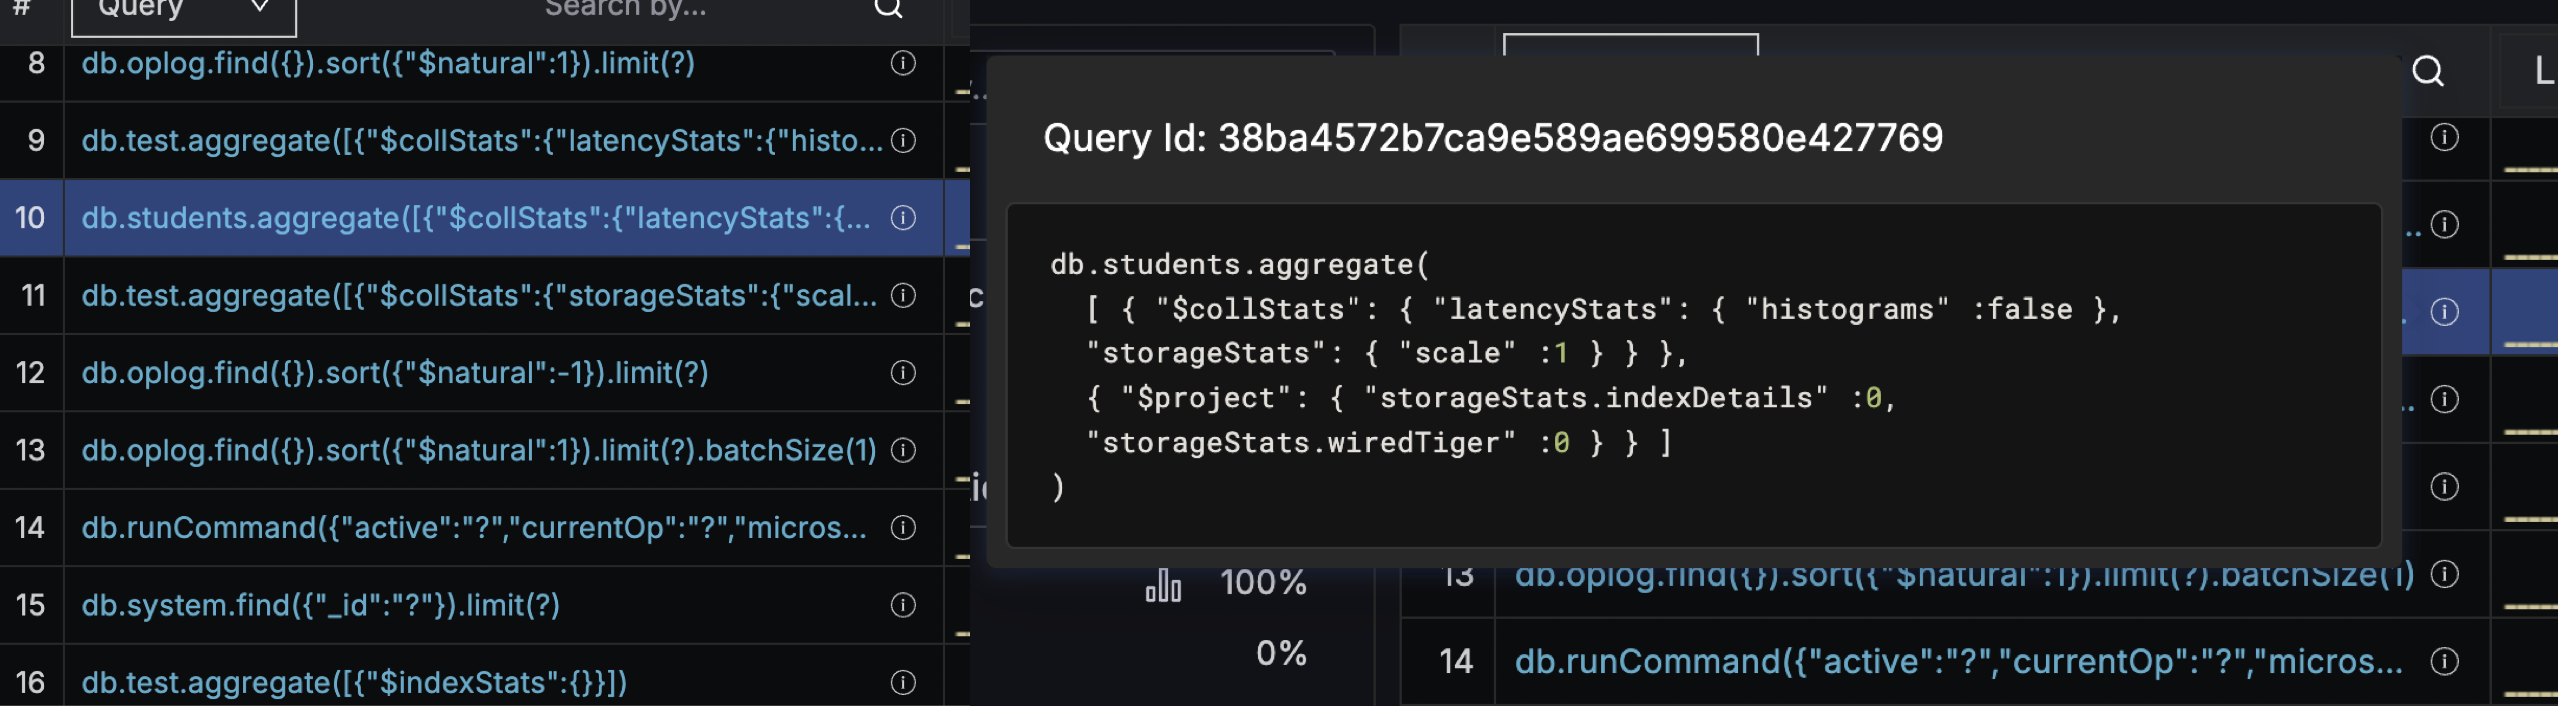
Improved query fingerprint visualization
MongoDB query fingerprints in QAN now display the actual query structure, including operators and field names, similar to the format used in a MongoDB shell.
The previous display only showed operation type and collection name, which provided limited context for troubleshooting.
The new fingerprint format makes query patterns immediately recognizable while still anonymizing sensitive data.
Enhanced query examples visualization
We've refined the query examples interface in Mongo QAN by removing unnecessary enumeration labels ("1 item", "2 item", etc.) and upgrading the JSON viewer component.
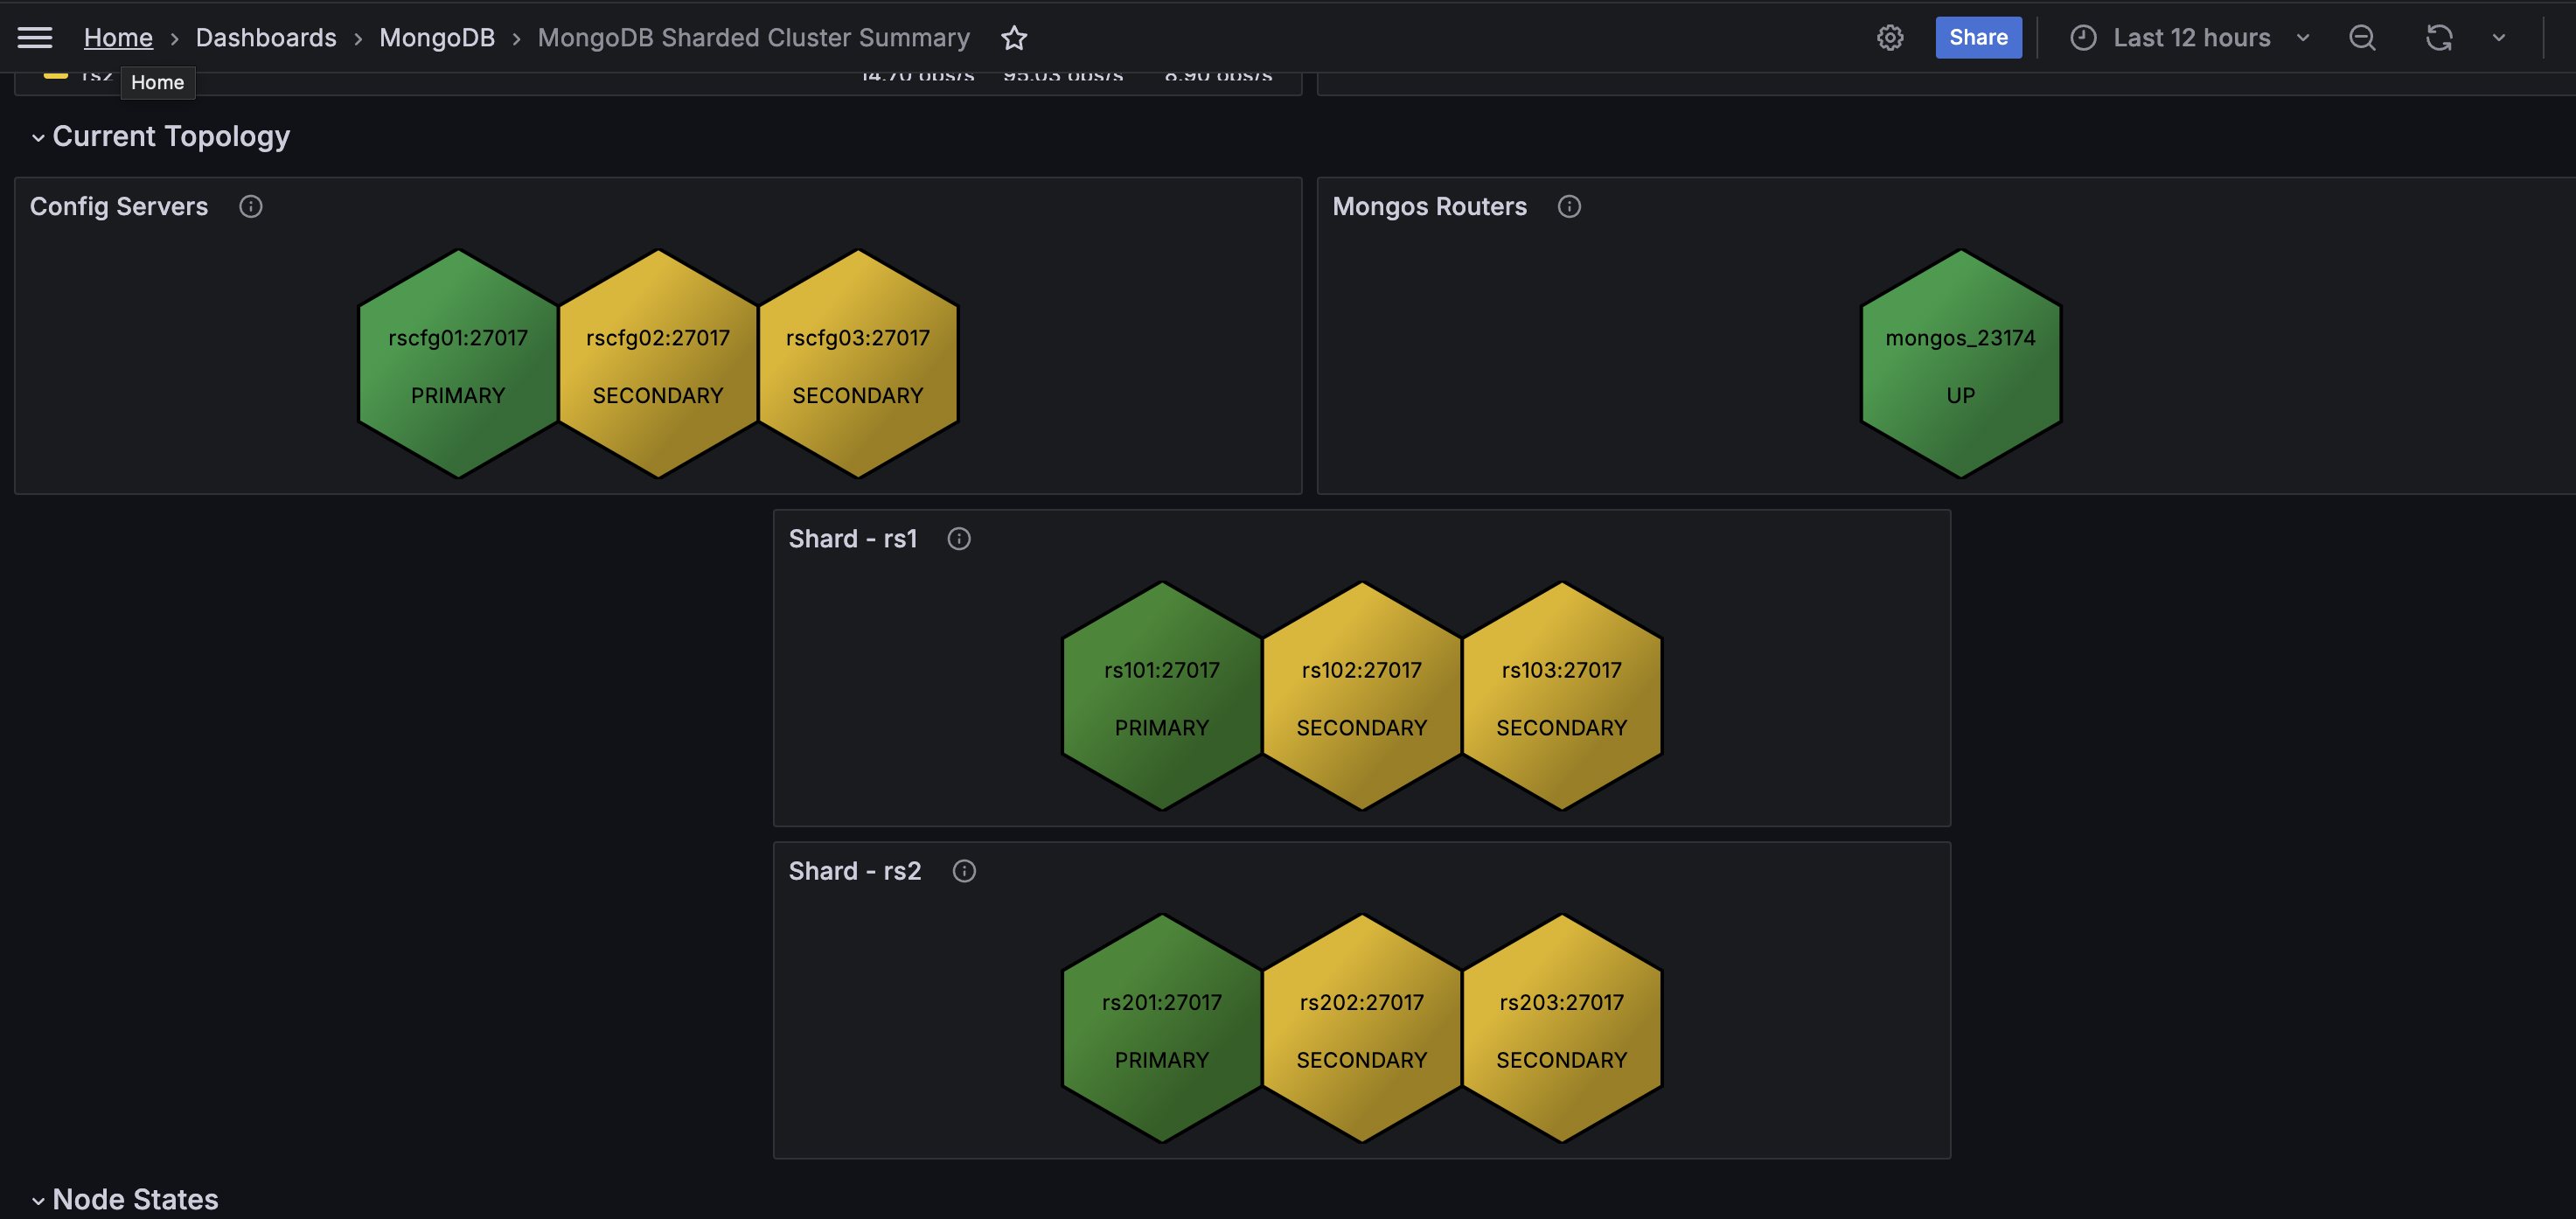
Improved MongoDB cluster topology visualization
We have enhanced the MongoDB Cluster Summary dashboard with a redesigned Current Topology section.
This section now properly categorizes MongoDB cluster components—shards, config servers, and mongos routers—within their appropriate hierarchical sections. This replaces the previous implementation that incorrectly grouped all components under the Config Servers section.
Enhanced MongoDB dashboard visualizations
Based on community feedback, we've made several improvements to the MongoDB ReplicaSet Summary and MongoDB Sharded Cluster Summary dashboards:
- improved detection of node states to better identify down nodes
- optimized Top Hottest Collections panel showing only the most critical data
- improved readability with rounded numbers in Overview panels
- increased precision with decimal values (tenths) in Top Hottest Collections panels
- resolved visualization issues in Disk I/O and Network traffic panels for more reliable performance monitoring
Enhanced filtering capabilities
We've improved the filtering experience on the MongoDB Instances Compare dashboard with four new selection boxes in addition to the existing Service Name filter. These filters allow you to narrow down instances by:
- Replication Set
- Environment
- Cluster
- Node
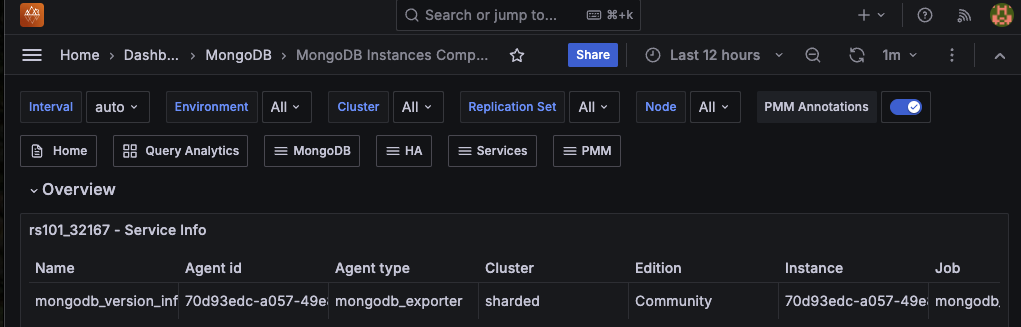
These additional filters make it easier to navigate and compare MongoDB instances in larger environments, enabling you to quickly narrow down the specific instances you want to monitor.
Enhanced role-based access control
We've refined role-based access for Advisors and Alerts, making it easier for teams to collaborate while maintaining security boundaries:
Advisors access for Editors
Users with the Editor role can now access Advisors insights without requiring Admin privileges. This is especially beneficial in managed service environments where Admin access is typically restricted to database administrators.
While Editors can view Advisors insights, only Admins can run, disable, or edit Advisors.
Expanded access to fired alerts
The Fired Alerts page under Alerting is now accessible to both Viewer and Editor roles, allowing teams to monitor triggered alerts without needing elevated permissions:
- Editors can now view and silence alerts directly from the Fired alerts page. Previously, silencing alerts was only possible via the Alert rules page.
- Editors also gain full access to alert templates including the ability to view, create, edit, and delete templates.
- Viewers cannot access or modify alert templates, protecting critical alert configurations.
For more details, see PMM roles and permissions.
Improvements
-
PMM-12161 - MongoDB components are now properly organized in the Cluster Summary dashboard, replacing the confusing layout where all appeared under Config Servers.
-
PMM-13545 - Enhanced MongoDB dashboard visualizations with improved node state detection, optimized Top Hottest Collections panels, better number formatting, and fixed visualization issues in the Disk I/O and Network traffic panels.
-
PMM-12468, PMM-9288 - Enhanced MongoDB QAN with additional metrics, new filter categories, and the ability to ide...
v3.0.0
Percona Monitoring and Management 3.0.0
| Release date | January 30th, 2025 |
|---|---|
| Installation | Installing Percona Monitoring and Management |
| Upgrade | Migrate PMM 2 to PMM 3 |
Percona Monitoring and Management (PMM) is an open source database monitoring, management, and observability solution for MySQL, PostgreSQL, and MongoDB.
PMM empowers you to:
- monitor the health and performance of your database systems
- identify patterns and trends in database behavior
- troubleshoot issues effectively
- execute database management tasks seamlessly, whether your databases are on-premises or in the cloud
General availability of PMM 3.0.0
We're excited to announce the General Availability of PMM 3.0.0, a new major version that introduces a complete architectural overhaul of PMM.
This milestone delivers major security improvements with rootless deployments, encryption of sensitive data, enhanced stability through containerized architecture, and improved user experience with flexible monitoring configurations. Key changes include official ARM support, MongoDB 8.0 monitoring, and a streamlined upgrade process.
Release summary
- Security enhancements
- Enhanced stability
- Improved user experience
- Monitoring improvements
- Breaking API changes
- Component upgrades
- Improvements
- Fixed issues
Security enhancements
Support for rootless deployments
Using the root user in applications poses a significant security risk, particularly when outdated software is installed or resides in the environment.
PMM Server now supports rootless deployment through multiple methods, including the latest versions of Podman, Helm, Docker, Virtual Appliance, and Amazon AWS.
This rootless setup enhances security by eliminating the need for root privileges to create, run, and manage containers. By running PMM Server as a non-root user, you avoid granting root permissions on the host system, providing an additional layer of protection against potential vulnerabilities and security breaches.
For instructions on deploying rootless PMM, check the Setting up PMM Server topic.
UI-based upgrades for Podman installations
You can now upgrade PMM Server installations running under Podman directly through the PMM Configuration > Updates panel in the UI.
This functionality integrates Watchtower for automated container updates and requires configuration of new environment variables (PMM_WATCHTOWER_HOST, PMM_WATCHTOWER_TOKEN) as well as relevant systemd service settings.
For detailed configuration instructions, see Installation with UI updates.
Encryption of sensitive data
Plaintext passwords and credentials are among the top ten security risks identified by OWASP (Open Web Application Security Project).
To address this risk, PMM now encrypts all sensitive information stored in its database. This includes usernames, passwords, AWS keys, Azure credentials, and TLS/SSL certificates, significantly enhancing the security of your monitoring environment. Even though we recommend minimal privileges for monitoring user accounts, you can rest assured that the sensitive data is protected!
By default, PMM generates an encryption key and stores it at /srv/pmm-encryption.key. Alternatively, you can define a custom path for the encryption key using the new environment variable PMM_ENCRYPTION_KEY_PATH.
When upgrading to PMM 3, any existing unencrypted PMM 2 data will be encrypted automatically.
For more information, see PMM data encryption.
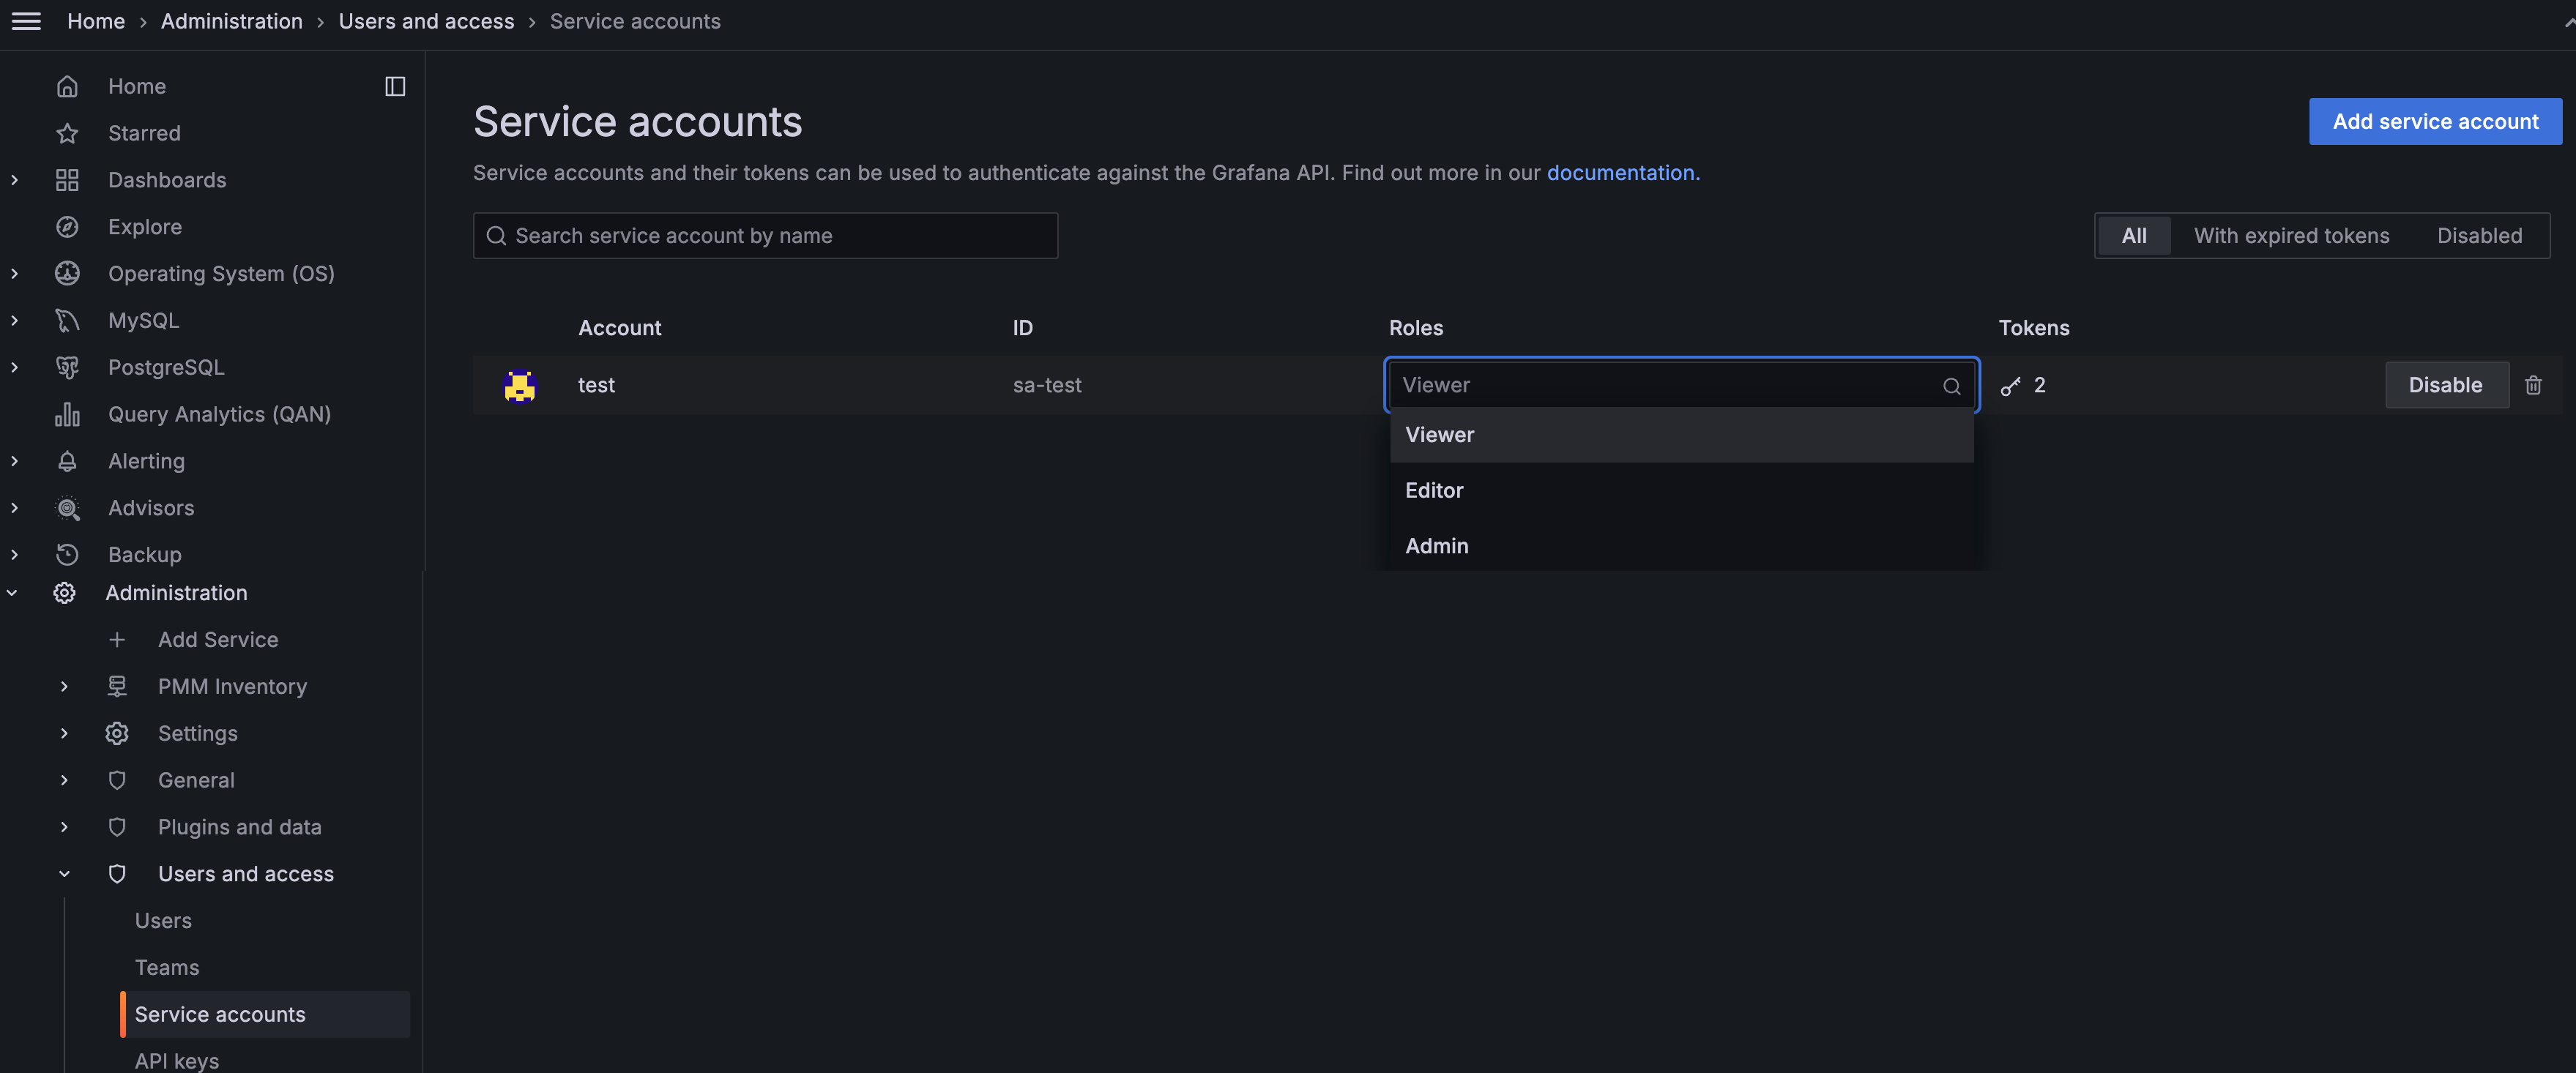
Enhanced API authentication with Grafana service accounts
We've made a significant enhancement to the way API authentication is handled. PMM no longer relies on API keys as the primary method for controlling access to the PMM Server components and resources. Instead, PMM now leverages Grafana service accounts, which provide a more secure and manageable authentication mechanism compared to API keys.
Service accounts provide better security through fine-grained access control while maintaining detailed audit logs of all actions. This includes comprehensive tracking of elevated privilege operations and improved visibility into access patterns - continuing the logging capabilities previously available with API keys.
Migration from API keys
With this change, API keys are now deprecated and will be automatically converted to service accounts. Here's what happens when upgrading from PMM 2 to PMM 3:
- your existing API keys remain functional but are moved to service accounts
- the conversion happens when you first log in as an Admin user or via CLI
- your integrations will continue working with the same API key credentials (hash values remain unchanged)
- the keys will appear under Administration > Users and Access > Service Accounts
For more information see Migrate to PMM 2 to PMM 3 and Service account authentication.
CVEs eliminated through architectural changes
The removal of legacy components like Integrated Alerting and DBaaS, combined with the security enhancements above, eliminates multiple potential vulnerabilities and CVEs. This makes PMM 3 our most secure release yet.
Enhanced stability
Containerized PMM architecture for AMI and OVF deployments
Previously, AMI and OVF instances of PMM were created as standalone images rather than being containerized like the primary Docker-based PMM version.
This difference in architecture led to challenges in maintenance as fixes and updates for AMI and OVF instances required additional effort and were sometimes delayed due to their lower adoption rates.
With this update, PMM now uses a unified containerized architecture across all deployment methods. In AMI and OVF environments, PMM components run as Podman-managed containers in rootless mode, eliminating the need for elevated system privileges.
This transition not only aligns AMI and OVF deployments with PMM's core containerized model but also improves security, enables faster troubleshooting, and streamlines updates and patch management.
More stable and quicker upgrades
PMM 3 introduces a significant upgrade system overhaul, replacing the earlier method based on internal package updates. While the previous approach offered the convenience of upgrading directly via the Update button on the Home dashboard, it was prone to connection issues and package corruption, often resulting in complex recovery challenges.
The new upgrade method moves away from RPM updates to exclusive container updates, eliminating RPM-related complications. This streamlined approach provides consistent upgrade experiences across all deployment types — Docker, Podman, and OVF/AMI.
At the same time, we're maintaining the UI upgrade option by integrating Watchtower, an external upgrading tool. When you click the Upgrade Now button on the Home Dashboard, Watchtower seamlessly replaces the PMM Server container and links the new one to the existing volume, preserving all data and settings intact.
For easy adoption, Watchtower comes pre-configured in our Easy-Install script, enabling one-step PMM setup.
Reduced PMM container image size
We've optimized the PMM 3 container image from 3.1GB to 2.6GB, reducing its size by 0.5GB. This reduction improves download speeds and enhances deployment reliability, particularly beneficial for environments with limited storage capacity or bandwidth constraints.
Improved user experience
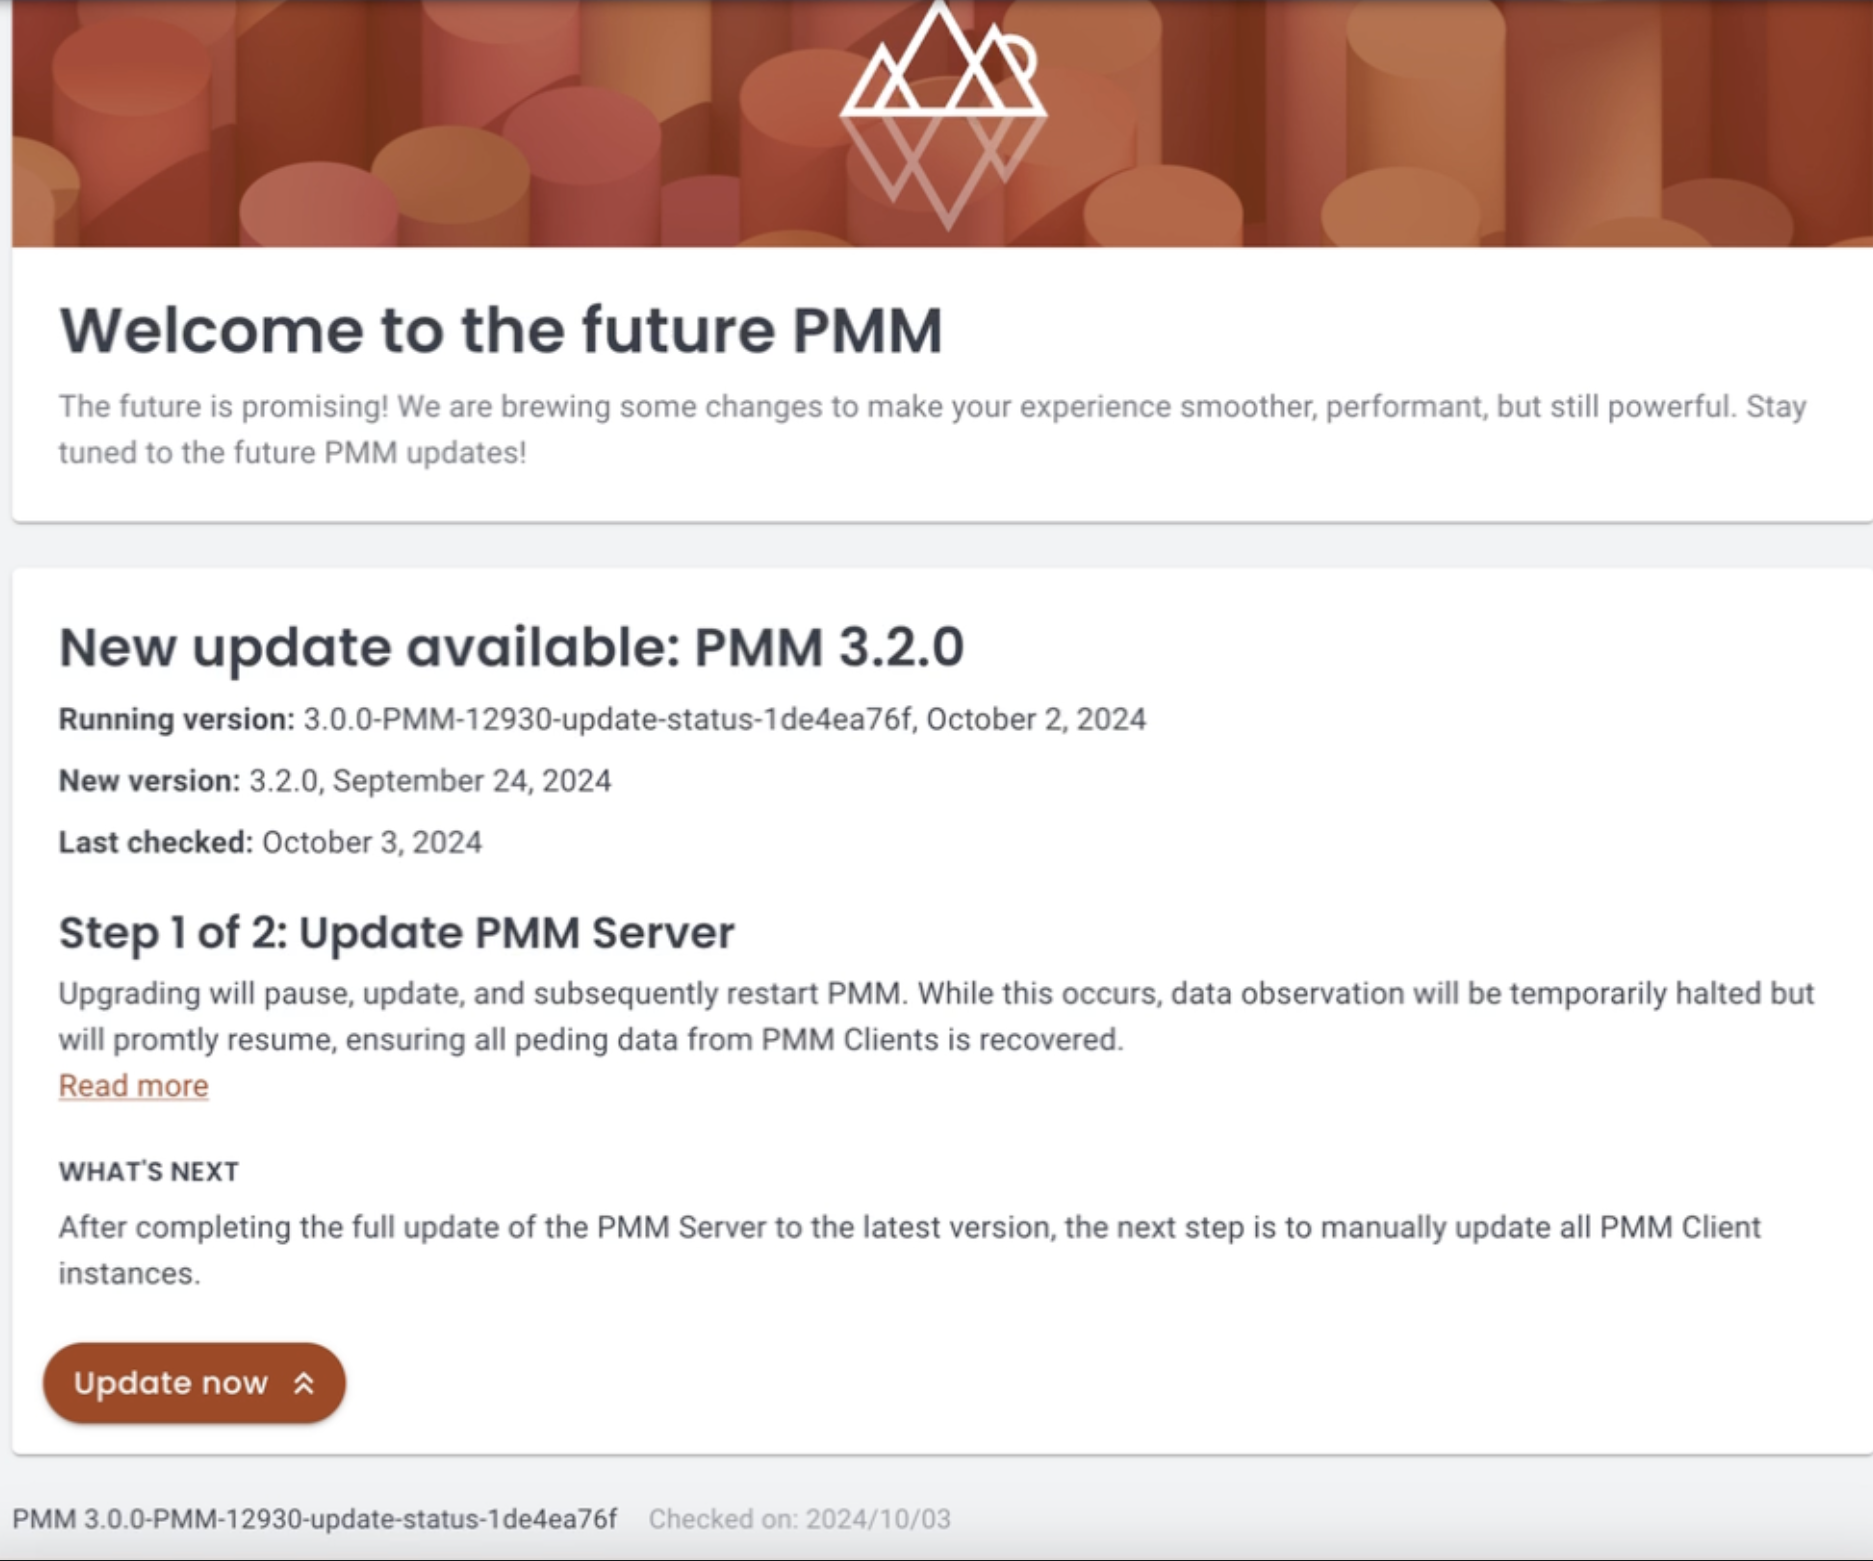
New upgrade UI
We've introduced a new Updates page under PMM Configuration to support the new container-based upgrade system. This centralized interface offers clear visibility into the versions and configurations of both your PMM Server and Clients, simplifying the update process.
With this update, you'll receive proactive notifications whenever new versions are released to help you make informed decisions before proceeding with available upgrades.
Flexible monitoring configurations
PMM extends its database monitoring setup process by adding an intuitive UI-driven approach alongside CLI-based configuration. After installing PMM Client on your database server, all further monitoring configurations can be managed directly through the PMM interface, eliminating the need for complex command-line operations.
This simplified w...
v2.44.0
Percona Monitoring and Management 2.44.0
| Release date | December 13th, 2024 |
|---|---|
| Installation | Installing Percona Monitoring and Management |
Percona Monitoring and Management (PMM) is an open source database monitoring, management, and observability solution for MySQL, PostgreSQL, and MongoDB.
It enables you to observe the health of your database systems, explore new patterns in their behavior, troubleshoot them, and execute database management operations regardless of whether your databases are located on-premises or in the cloud.
Support for version 8.0 of Percona Server for MongoDB (PSMDB), MongoDB Community, and MongoDB Enterprise
The latest version of MongoDB Community edition, along with the upcoming PSMDB 8.0, introduce numerous improvements and significant performance enhancements.
We have updated PMM 2 to include support for these new versions, including changes to mongodb_exporter to accommodate the revised metrics structure (e.g., wiredTiger.concurrentTransactions is now queues.execution).
The MongoDB Oplog Details dashboard has also been adapted to support MongoDB 8.0's new oplog metrics, with updated panels for Oplog Buffered Operations and Buffer Capacity.
!!! hint alert alert-success "Important notes"
- This enhancement requires PMM Agent version 2.43.1 or later.
- MongoDB 8.0 introduces significant changes to its internal metrics structure. While we have updated PMM’s built-in dashboards to reflect these changes, you may need to update any custom dashboards to align with the new metrics.

- When using the `--enable-all-collectors` flag, monitor memory usage carefully with MongoDB clusters, especially in sharded environments with multiple collections. If you frequently create new collections or work with many collections, disable the `collstats` collector to prevent memory consumption issues.
Improved PostgreSQL 17 metrics collection
PMM 2.44.0 strengthens monitoring capabilities for PostgreSQL 17, building on the recent support for Query Analytics (QAN) introduced in PMM 2.43.2.
This previous release updated field names for PostgreSQL 17 compatibility (e.g., blk_read_time to shared_blk_read_time).
This release further enhances PostgreSQL monitoring with updated queries aligned with PostgreSQL 17's schema changes to ensure accurate metrics collection in the PostgreSQL Instances Overview dashboard.
We've also improved collector support, including proper recognition of PostgreSQL 17 columns like checkpoints_timed in the stat_bgwriter collector.
Fixed metrics collection for MongoDB backups
We've resolved an issue where Percona Backup for MongoDB (PBM) metrics were not being scraped by default and required the --enable-all-collectors flag.
With this fix, PBM metrics are now automatically collected when MongoDB services are added to PMM, without requiring additional configuration.
However, PBM metrics collection is disabled for PMM Clients 2.43.0 and 2.43.1 due to a memory leak identified in these versions. This functionality is supported starting with PMM Client 2.43.2 and later.
v2.43.2
Percona Monitoring and Management 2.43.2
| Release date | October 30th, 2024 |
|---|---|
| Installation | Installing Percona Monitoring and Management |
Percona Monitoring and Management (PMM) is an open source database monitoring, management, and observability solution for MySQL, PostgreSQL, and MongoDB.
It enables you to observe the health of your database systems, explore new patterns in their behavior, troubleshoot them, and execute database management operations regardless of whether your databases are located on-premises or in the cloud.
PostgreSQL 17 support for Query Analytics (QAN)
This patch release adds PostgreSQL 17 support for Query Analytics with updates to the pg_stat_statements and pg_stat_monitor extensions.
To align with PostgreSQL 17 standards, we've renamed the blk_read_time field to shared_blk_read_time and the blk_write_time field to shared_blk_write_time.
All dashboards reflect these changes, and the API supports both old and new field names, for backward compatibility.
Secure Grafana image rendering
PMM Server now supports secure Grafana image rendering capabilities through a dedicated container deployment, providing isolated rendering operations without impacting PMM Server resources.
Previously installed directly within PMM Server, the Grafana Image Renderer plugin now runs in a separate container, offering secure HTTPS communication and custom CA certificate configuration through the PMM API.
To update the plugin installation:
-
Deploy the Grafana Image Renderer container (
grafana/grafana-image-renderer:latest) alongside PMM Server within the same Docker network. -
Configure PMM Server with the following environment variables, where
rendereris the hostname of the Grafana Image Renderer container, andpmm-serveris the hostname of PMM Server within the Docker network:GF_RENDERING_SERVER_URL=http://renderer:8081/renderGF_RENDERING_CALLBACK_URL=https://pmm-server:8443/graph/
Fixed: High memory consumption in MongoDB exporter
We have updated the MongoDB exporter to address a critical issue present in version 2.43.1 where unclosed connections led to increasingly high memory consumption over time.
This resolves the Failed to get PBM configuration error, the users may have encountered as a result of the memory leak, and significantly reduces the rate of increase in total memory allocations.