Releases: scottpdo/flocc
0.5.9
Heatmap bugfixes
As is often the case right after a feature launch, I noticed a couple bugs with how Heatmaps worked:
- If axis labels didn't start on an integer, they didn't always draw them. Now the left/bottom-most value marker should always be drawn, and subsequent ones will be drawn if there's space for them.
- More oopsie-boy is that some cell values were being incorrectly drawn! One calculation used
x | 0in place ofMath.floor(x)to round down. But for negative values, this acts likeMath.ceil, since it always just removes the float-point portion of the number, leaving the integer. This resulted in negatives values between -1 and 0 being drawn as if they belonged to the range 0 and 1. This is fixed now!
0.5.8
Heatmaps
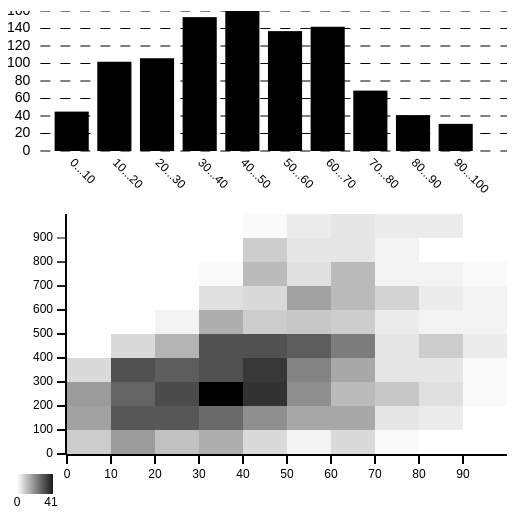
0.5.8 introduces a new renderer: the Heatmap. A Heatmap, similar to a Histogram, visualizes the number of Agents with data in a certain range, but compares two dimensions against each other.
In the below diagram, a Heatmap and a Histogram both render the same Environment. There is a distribution of Agents with different age and wealth values. The Histogram above shows the distribution of Agents by age. The Heatmap below shows how wealth correlates with age. From the Histogram, we can see that the highest concentration of ages are between 30 and 50, but the Heatmap also lets us see that most Agents between 30 and 50 have wealth between 200 and 500.
The API for Heatmaps looks like this:
const heatmap = new Heatmap(environment, {
  x: 'age',
  y: 'wealth'
});
However, the above constructor sets defaults for the ranges to be 0 to 1. To set different ranges, as well as adjust other options, use the following constructor:
const heatmap = new Heatmap(environment, {
  x: {
    key: 'age',
    max: 100
  },
  y: {
    key: 'wealth',
    max: 1000
  }
});
The complete set of options (with defaults shown) in the constructor are:
const heatmap = new Heatmap(environment, {
  width: 500, // width of the visualization
  height: 500, // height of the visualization
  from: 'white', // color of a cell with 0 agents in it
  to: 'black', // color of a cell with highest # of agents in it
  scale: 'relative', // can be "relative" or "fixed" — if 'relative' dynamically sets the highest # of agents based on current distribution; if 'fixed' you set the highest # of agents with the 'max' option
  max: [number], // when using a 'fixed' scale, this is the max value on the scale
  x: {
    key: 'x',
    min: 0,
    max: 1,
    buckets: 10 // the # of buckets horizontally
  },
  y: {
    key: 'y',
    min: 0,
    max: 1,
    buckets: 10 // the # of buckets vertically
  }
});0.5.7
Histogram Updates
Histograms can now render multiple metrics on the same chart. In addition to adding a metric to a Histogram by calling histogram.metric('key');, one can now either pass in an array of strings, or individual strings as separate parameters, like this:
histogram.metric(['key1', 'key2', 'key3']);
// or
histogram.metric('key1', 'key2', 'key3');
By default (like with a single metric), all bars will be colored in black. To differentiate by color, the color option value (used when instantiating a new Histogram) can be either a string or an array of strings:
const histogram = new Histogram({
  color: ['blue', 'red', 'green']
});
Metrics are grouped together visually like this:
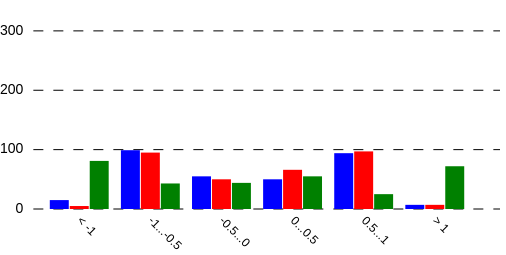
Also, labels are now shown at a 45 degree angle below their bar(s), so that they should not run into each other. There may be a risk of them running off the canvas, but since decimals are clipped to 3 places, this hasn't shown up in testing.
0.5.6
KDTree optimizations
KDTrees should now only update when they need to, rather than rebalancing with every Environment.tick. If an Agent is tracked in a KDTree, and its x, y, or z data gets updated, and if that update causes the Agent to move outside of the bounding box of its current subtree, then the subtree's parent (or up the chain until it reaches a bounding box the Agent is still inside of) gets marked as needing updating. With every Environment.tick, the top-level KDTree only rebalances if it is marked as needing updating. Otherwise, it recursively searches its left and right subtrees, and only rebalances those subtrees that need updating.
KDTrees will also automatically resync their Agents to those in the Environment if the Environment adds or removes an Agent.
Other updates
- Fixed some JSDoc notes for
NetworkandTerrain - Added
KDTreetests - Updated local version of Node to 14.7.0
0.5.5
0.5.2
This one is more than a bit embarrassing... A small but very important change to the implementation of utils.random and utils.sample.
utils.random
For non-floating values, previously utils.random had been using Math.random to round to the nearest integer. Because of this, the minimum and maximum values had been systematically underweighted. For example, calling utils.random(0, 1) would return 0 or 1 with equal probability. However, calling utils.random(0, 2) would return 2 50% of the time, and 0 or 1 only 25% of the time. Very very bad!!
The implementation is fixed to use Math.floor to round down (following lodash's implementation).
utils.sample
When using weights, utils.sample had previously iterated over the (normalized) weights and compared a random number to the weight. However, because it called utils.uniform for each weight, when it passed over the first few weights, the newly generated uniform value would be more likely to pass. Now it only calls uniform once, so all weights should be equally likely (relative to their value) to be chosen based on the uniform.
0.5.0
The 0.5.0 release focuses on data representation and repeatability. To that end, the major new features are the TableRenderer class and a new utility function, utils.seed.
TableRenderer
The TableRenderer class renders agent data as rows of an HTML table or CSV, with the ability to sort, filter, and limit the data that is represented. Usage:
const environment = new Environment();
const renderer = new TableRenderer(environment, {
  filter: a => a.get('size') > 50, // only show agents with a "size" greater than 50
  limit: 20,                       // limit to 20 rows (after filtering and sorting)
  sortKey: 'size',                 // sort by "size" value
  order: 'asc',                    // sort in ascending order
  refresh: 250,                    // re-render at most once every 250 milliseconds
  type: 'csv'                      // render as a CSV
});
utils.seed
Call utils.seed(n) before calling any functions that rely on pseudo-randomness to produce repeatable values. Seeding ensures that utils.gaussian, utils.random, utils.sample, and the new utils.uniform will produce the same values across different runs of the simulation. This allows the results of models to be validated and interpreted across separate runs.
Other updates
- New utility function
utils.uniform— an alias for callingutils.random(0, 1, true); - Deprecating
GridEnvironmentandASCIIRendererand including console messages in case a user uses them. These classes will be removed in v0.6.0.
0.4.8
Terrain loop order randomization
This minor release includes a new utility function, series — a linear congruential generator that randomly iterates over the range [0 ... n) without repeating any values and hitting each value in the range exactly once. So for const generator = series(5);, we might see:
generator.next().value; // 3
generator.next().value; // 2
generator.next().value; // 0
generator.next().value; // 1
generator.next().value; // 4
This allows Terrains to efficiently (low space cost, relatively low time cost) loop over all cells in pseudo-random order. To opt into this, simply call environment.tick({ randomizeOrder: true }) in the tick function. This will avoid artifacts that occur as a result of iterating in x-y order, like in the Segregation model:

0.4.6
0.4.5
Terrain
Add new option: scale
const [width, height] = [400, 800];
const terrain = new Terrain(width / 2, height / 2, { scale: 2 });
The width and height of the terrain should always be in grid space (the number of scales across and up), not screen space (the number of pixels). Those values will be multiplied by the scale option to get the rendered size in pixels.
Utility Function
gcd (greatest common denominator). Pretty straightforward.