Replies: 6 comments 22 replies
-
|
I would absolutely love your input on this! My idea at the moment is extremely vague. I'm interested in using Web Components for this, for a few reasons:
Imagine being able to construct an initial dashboard something like this: <html>
<head><title>My Dashboard</title>
<script type="module" src="default-datasette-dashboard-widgets.js"></script>
</head>
<body>
<h1>My Dashboard</h1>
<h2>Recent stars</h2>
<table-summary
url="https://github-to-sqlite.dogsheep.net/github/stars"
size="5"
></table-summary>
<h2>Commits per day</h2>
<bar-chart
database="https://github-to-sqlite.dogsheep.net/github"
sql="select substr(author_date, 0, 11) as day, count(*) as commit_count from commits where author = 9599 group by day order by day desc limit 10"
x="day"
y="commit_count"
></bar-chart>
<h2>Covid worst counties</h2>
<table-summary
url="https://covid-19.datasettes.com/covid/latest_ny_times_counties_with_populations?_sort_desc=deaths_per_million"
size="10"
></table-summary>
</body>
</html>The |
Beta Was this translation helpful? Give feedback.
-
|
Interesting! I was contemplating something similar but I hadn't considered adding sql to the html. That might make things much easier. I don't know if you'd really need webcomponents for this though. |
Beta Was this translation helpful? Give feedback.
-
|
This is a bit of a stream of thought, but I'm really just trying to think about how Datasette would compare, how I imagine it working, and what makes me excited about using it for this purpose. Datasette's FoundationI think that Datasette already has some major advantages over existing dashboard solutions.
Layout and StylingI think most dashboarding tools end up being limited or leaky abstractions over web technologies already, so just exposing those technologies to the users will end up empowering them and providing them with more transferable skills (like Datasette already does with SQL). The biggest obstacle for analysts to build dashboards with these technologies has been the back end which is what Datasette is providing (and more). VisualizationsJavaScript already has the best in class visualization libraries (D3, Vega/Vega-Lite, Plotly). Just opening up this world to a larger user base will greatly expand what they can create. Even some of the tools with better visualization capabilities like Tableau still can be easily out classed by these existing libraries. Controls and InteractionsMany dashboarding tools focus on the visualization elements and maybe some sort of image type of element. These two types of elements are abused to create buttons, sidebars, navigational menus, and all kinds of other hacks. All of this to mimic the navigational style that users have become familiar with in web based tools. One type of control that is typically built-in, however, is tabs. It is very common for a dashboard to have multiple tabs with different views/subjects analyzed on each tab. This is really just a navigational element between pages, but is presented as tabs. Interactions linking separate visuals and also linking visuals to controls is something that has varing support in BI tools. Tableau probably offers the richest interactions, but there is a lot of potential for much better in a web based dashboard. This is what seems most tricky to me when thinking about building a dashboard based on Datasette. I'm guessing that this would be accomplished with named parameters in the SQL queries that are tied to selections from the charts or controls somehow. |
Beta Was this translation helpful? Give feedback.
-
|
What I see a lot in other dashboard frameworks like Dash, Panel, Streamlit, Voila, and Shiny is that they come with a lot of pre-styled components. I think that this can be useful for some audiences, but I would really like to see an option that is less opinionated on style that makes it easy for the designer to make it their own. If you look at some of the top dashboards built in Tableau, for instance, you will see a lot of eclectic styles. These don't all just look like admin dashboards. Of course, in corporations, there are plenty of less inspired designs. I mentioned before about how Datasette takes care of the backend issue. The other place that seems particularly tricky to an analyst like myself is wiring up the visuals and controls to each other and the data. This is a place where maybe the web components could help. I don't feel proficient enough in web development to have a clear idea about how this would work, but this is where the other frameworks above assist the designer/developer. |
Beta Was this translation helpful? Give feedback.
-
|
Sorry to debunk this old discussion, but recently I have had the need for a "baked-data" BI tool for several use-cases: a mix between Datasette and Metabase if you will. FYI, I successfully implemented the "baked-data" pattern by:
It works really well for my use-cases. However, Metabase is heavy (like really heavy, thanks JVM) and always requires authentication as internal BI tool is the main target. Also, I like the ecosystem and spirit of the Datasette project better, especially towards publishing Open Data. Is there currently any work/discussion/thinking about building highly composable dashboards and data visualizations with Datasette? (either built-in or as a plugin) |
Beta Was this translation helpful? Give feedback.
-
|
I am now contemplating if something like this might work. You sometimes want to link elements. <select sql="select distinct country_code from bigmac" id="varname"/>
<vegachart sql="select * from bigmac where country_code in countries" countries="varname">
{...}
</vegachart>Then again, there's a 80/20 rule here. The linking would make for a sweet demo, but in real life I'm probably be more interested in just a few simple line/scatter/bar charts. Note to self, vegalite also supports selectors in their json schema. |
Beta Was this translation helpful? Give feedback.
-
|
Thank you @koaning for sharing your train of thoughts and first experiments!
This is definitely one major painpoint of Metabase: one cannot configure data-sources/visualizations/dashboards using payload configs (e.g. YAML).
Mmmmh I see... From my perspective, I like the monolithic approach and ease of deployment of the "backed-data" pattern. Anyway, I'll think about all of these great ideas over the week-end and bring some more feedback if any! |
Beta Was this translation helpful? Give feedback.
-
|
@koaning you can discard my last observations about the "monolithic approach": I went through your experiment and saw that you are only defining custom templates and pages for Datasette (and not building an external tool as I first thought). I experimented quickly this week-end and I think there is some potential about building a nice configurable dashboarding/reporting tool on top of Datasette, using custom templates & pages. I planned a discussion with Simon to talk about it next week, will report if any new ideas come out of this! |
Beta Was this translation helpful? Give feedback.
-
|
The reason I'm building on top of datasette for now is because of CORS. The vega-editor comes with a node backend that can make requests on my behalf but if it all came via my front-end then backends are likely to block the request. That said, the ideas in Click me for a cool related demo.I actually got this work just now. I'm not just doing git scraping. I'm also doing the data hosting there. That means that github will kollekt and host. The github repo is here the dashboard from github pages is here. It's a demo using the |
Beta Was this translation helpful? Give feedback.
-
|
I just released the first version of |
Beta Was this translation helpful? Give feedback.
-
|
I really enjoy brainstorming all of the possibilities of Datasette as a BI tool. What I've been thinking about recently is the overall workflow of analyzing data then turning it into some sort or artifact to share. What I'd like is the ability to perform a literate analysis and then use some subset of that to turn into a dashboard, slide deck, or document. The way that I imagine it working is by writing in a markdown document within the Datasette instance. I could use code blocks for sql queries, then reference them in other code blocks that contain vega-lite specs. The results of this may be all that I need. I could either share a link to the HTML rendered or export it to some document format (pdf, doc, odf). If I needed more, I would be given the option to create a web page (dashboard). This would open up a view like CodePen or Glitch. I'd be able to reference the tables and visuals that I created in my exploratory document and add their There are many projects that provide a way do generate slides with markdown or html so I think that use-case could be easily fulfilled. While this would not be nearly as easy as a pure GUI tool or as flexible as Observable and/or a custom website, I think that it would hit a sweet spot between them. The skills learned in this setup (sql, markdown, json, html, css) would be transferrable in the future. I think that for many uses, a small subset of knowledge is all that would be needed and the tool could help with autocompletion and generating some code/skeletons. Some Vega-Lite links
Some future ideas
|
Beta Was this translation helpful? Give feedback.
-
|
Thanks @jcmkk3 for your thoughts! However, while doing some more coding on
The current state of this plugin is basic but gets the job done if you want to share a dashboard with a bunch of charts, defined only using a single metadata config file (you can literally slap Vega-Lite spec in charts and it just works). I updated the demo and see what we can already achieve with a single metadata file without much boilerplate (e.g. choropleth maps, Metabase-like interactivity). If this work resonates with what you are hoping for, please come share you valuable input and contribute! (I started a meta issue with all the improvement ideas I had so far) |
Beta Was this translation helpful? Give feedback.
-
|
@jcmkk3 I just released
I updated the online demo to showcase a dashboard with an analysis note next to charts, opening the door for "storytelling" analysis.
|
Beta Was this translation helpful? Give feedback.
-
|
This looks great! It really fits in pretty seamlessly with the styling/navigation of Datasette. |
Beta Was this translation helpful? Give feedback.
-
|
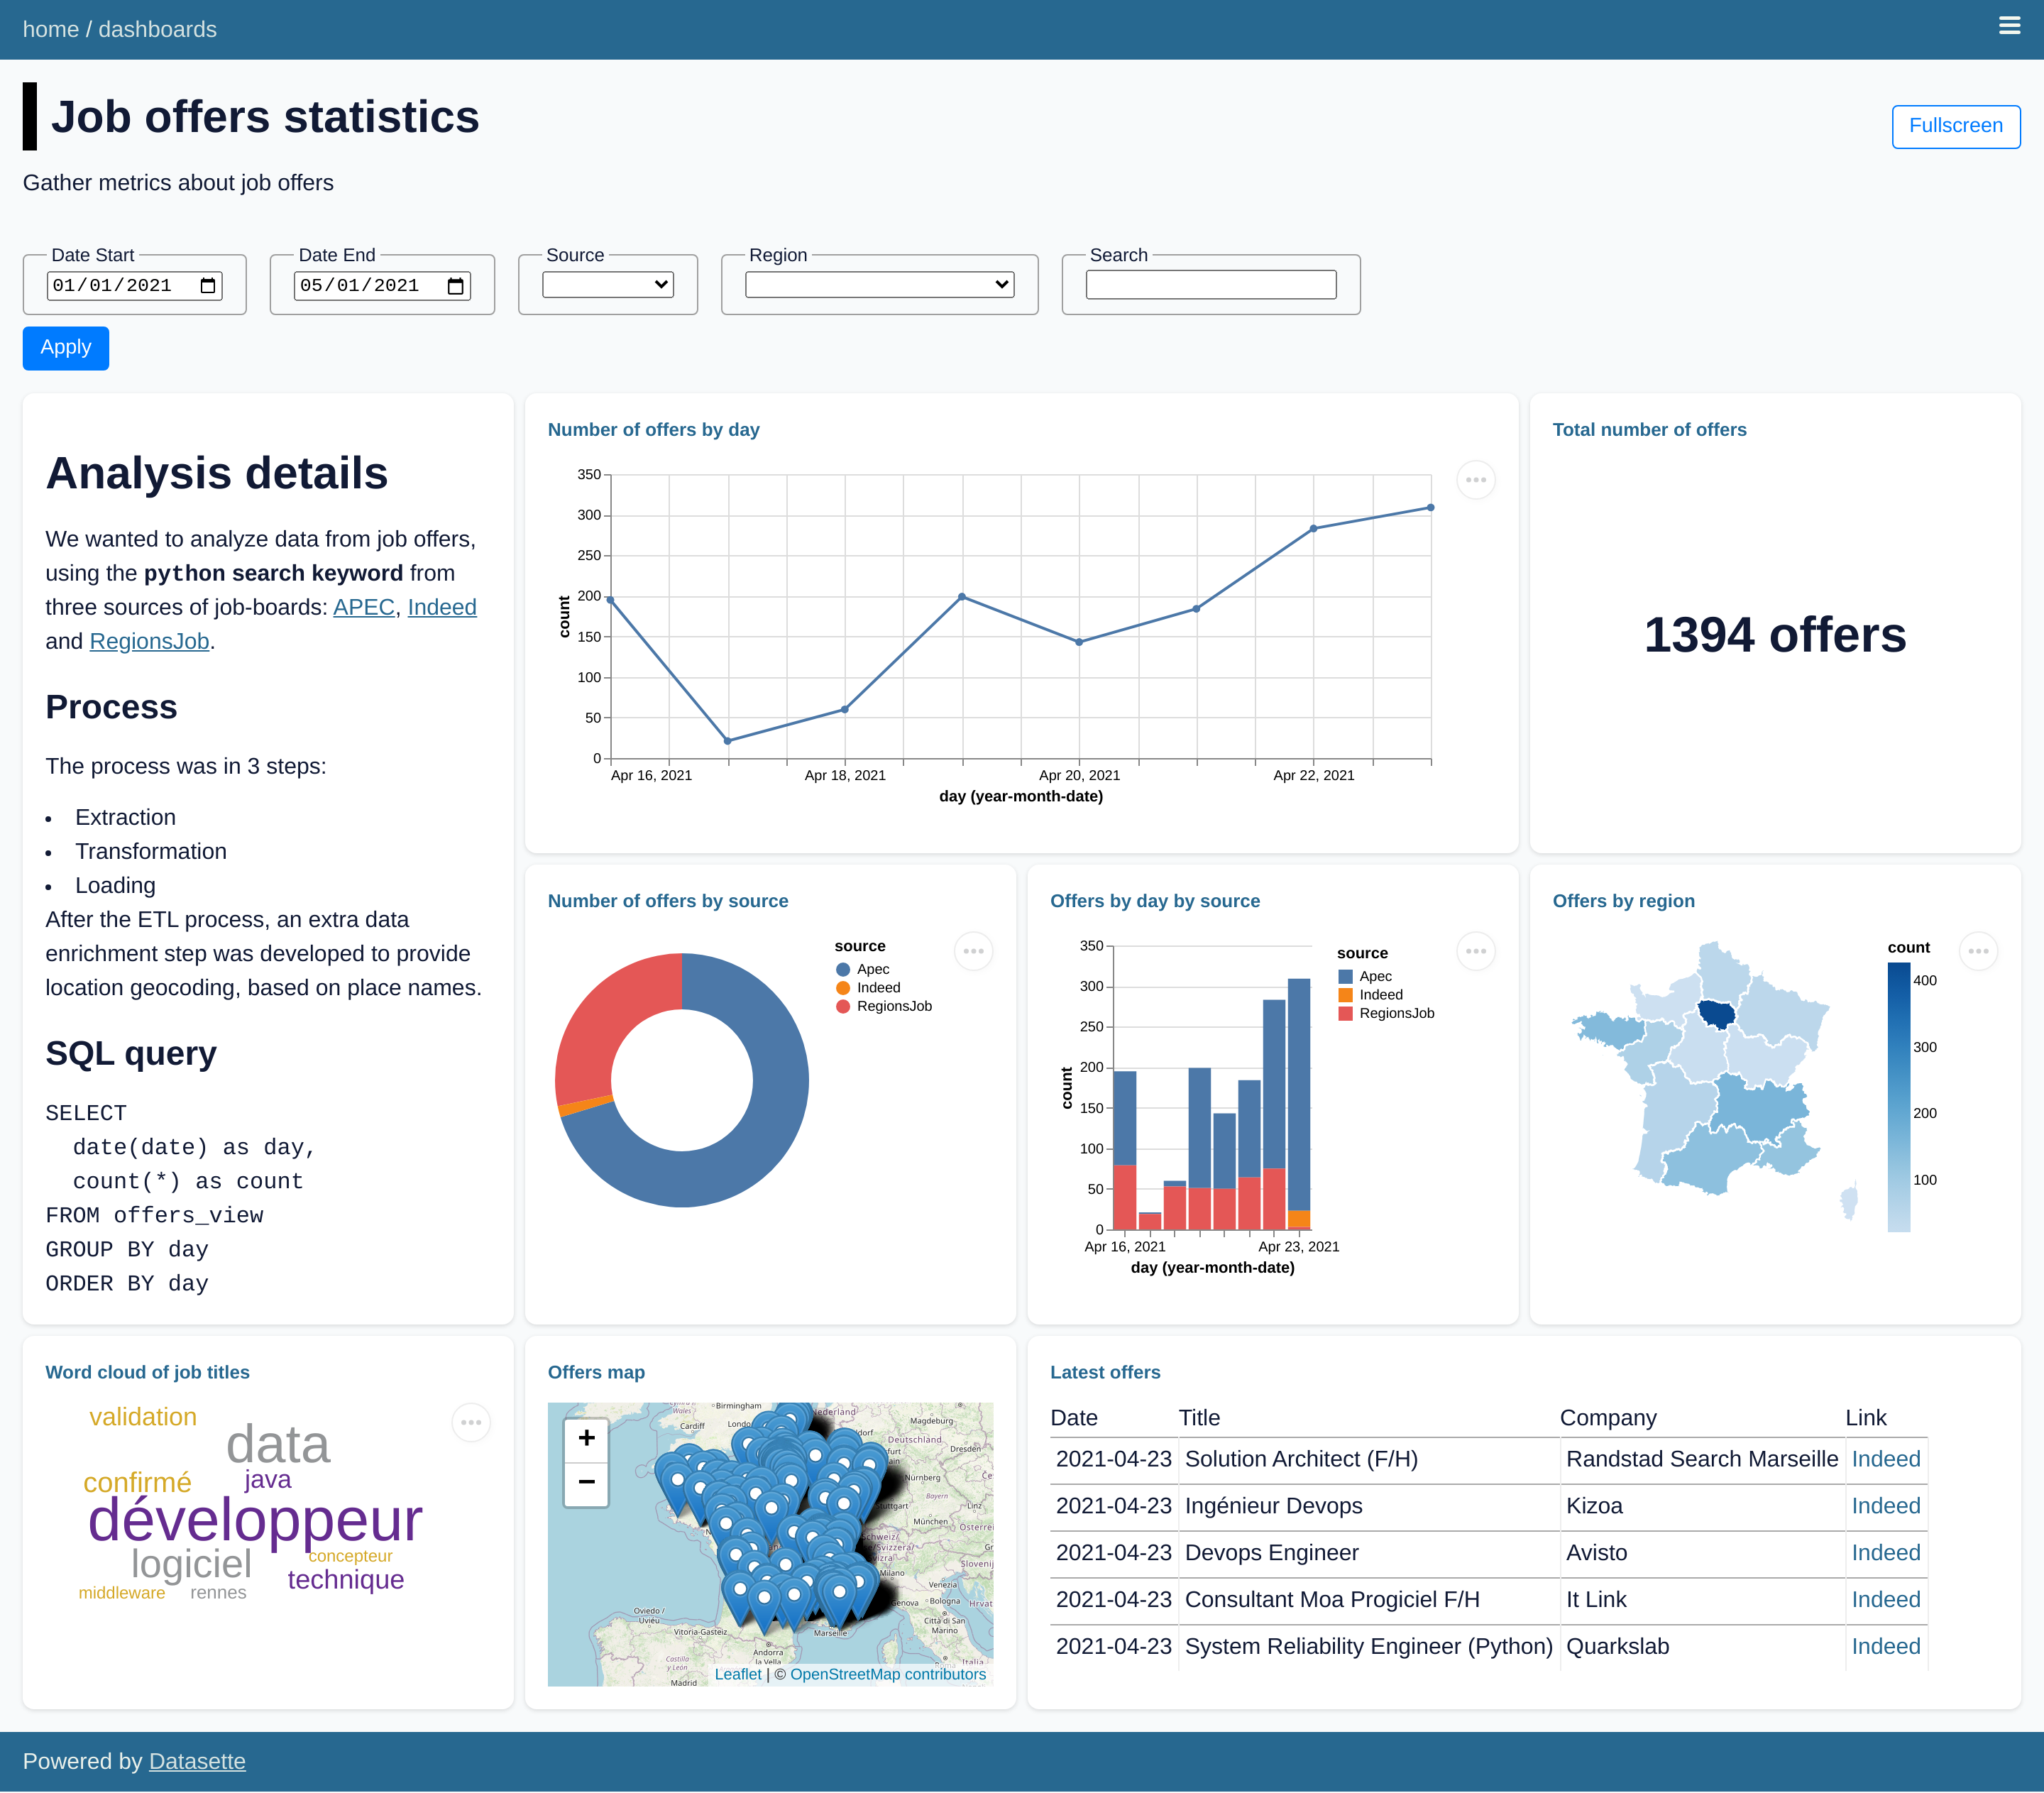
Here is my first experiment defining and generating data dashboards with Datasette: https://github.com/rclement/datasette-dashboards For now the idea is:
plugins:
  datasette-dashboards:
    my_dashboard:
      title: My Dashboard
      description: Showing some nice metrics
      visualizations:
        - title: Number of events by day
          chart: line
          encoding:
            x: { field: day, type: temporal }
            y: { field: count, type: quantitative }
          db: jobs
          query: SELECT date(date) as day, count(*) as count FROM events GROUP BY day ORDER BY day
This is really really basic for now. BTW, I spoke with @simonw today, he seemed to be enjoying the idea! Having more data analysis tools like these is something that could bring some less tech-savy audiences to use Datasette in day-to-day use (students, business departments, etc.). Here are some screenshots:
|


Beta Was this translation helpful? Give feedback.
-
|
Thanks for pointing out Calmcode, this seems an amazing resource for learners! I will definitely spread the word to my students! Are you producing the content all by yourself? Is the platform Open Source ? |
Beta Was this translation helpful? Give feedback.
-
|
Yes at the moment I'm the sole maintainer. The datasette course is the most popular one on the platform at the moment. There's a github where folks can post issues but it's not open source. I contemplated doing that, but there are some question/answer type things where you do not want the answer to be publicly available. |
Beta Was this translation helpful? Give feedback.
-
Okay fair enough. But from what I understand, this is not an "open-source" problem, this is a permission/access-control issue (RBAC), which is solved at runtime on the back-end side of things. I was just asking if it was OSS because the platform is really slick and the content is high-quality, and if it was built in the open that would be cherry on top! |
Beta Was this translation helpful? Give feedback.
-
|
Back on track with the dashboards: I introduced the |
Beta Was this translation helpful? Give feedback.
-
|
@rclement there have been moments where I thought open-sourcing it would be neat. But since it's something that's hard to reverse I figured delaying such decision would be best. I'm not looking forward to a lot of review work, but a part of me is thinking about ways people might collaborate. I've been running the project for a year now and although I really like where it's at ... I haven't really figured out what I'd like it to be in a years time. |
Beta Was this translation helpful? Give feedback.
Uh oh!
There was an error while loading. Please reload this page.
-
A couple of days ago Simon was posting a question on twitter about web component frameworks and referenced that he was looking at a use case for creating dashboards. I just wanted to chime in to say that I'm really excited to see what direction he takes this. I have always felt that this would be a great use for Datasette.
Simon, if you need any specific feedback about user's experience with other dashboarding tools, then I (and I'm sure other community members) would be happy to help.
Beta Was this translation helpful? Give feedback.
All reactions