Create barplot "sample.order" option doesn't work properly when stack = TRUE #48
Description
I believe this has been an issue for a long time unless I miss something but the sample.order ("increasing/decreasing") option in create.barplot doesn't work properly when stack = TRUE. BoutrosLab.plotting.general_7.0.3 was used to generate the plots below.
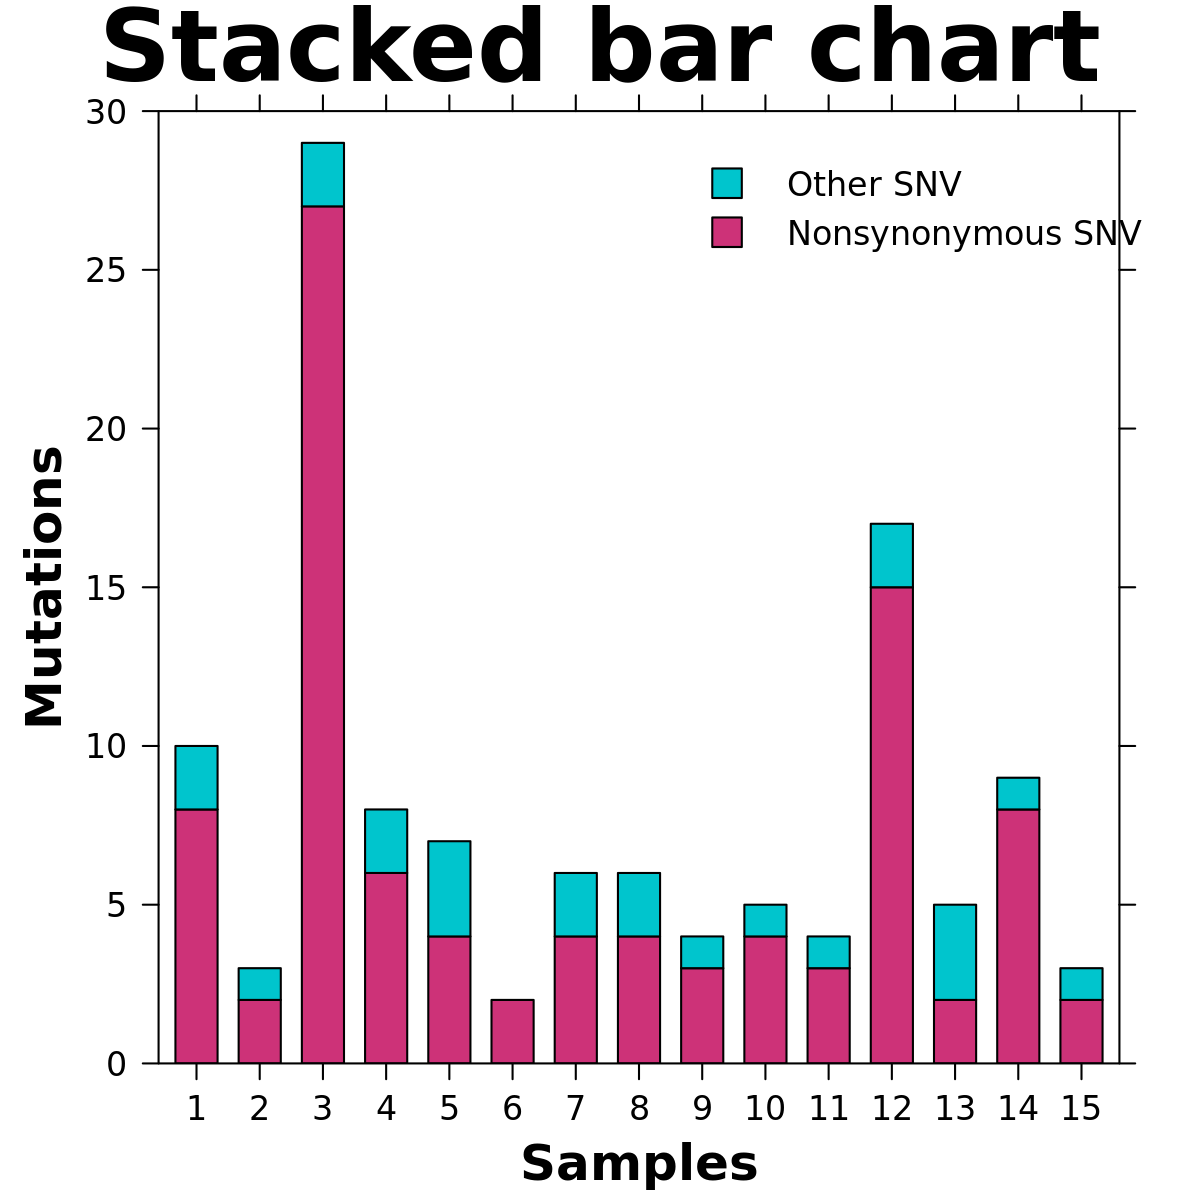
Without sample.order
create.barplot(
    filename = "stack.png",
    formula = values ~ samples,
    data = barplot.data,
    main = 'Stacked bar chart',
    xlab.lab = 'Samples',
    ylab.lab = 'Mutations',
    ylimits = c(0,30),
    yat = seq(0,30,5),
    xaxis.cex = 1,
    yaxis.cex = 1,
    xlab.cex = 1.5,
    ylab.cex = 1.5,
    xaxis.fontface = 1,
    yaxis.fontface = 1,
    groups = mutation,
    col = default.colours(12, is.greyscale = FALSE)[11:12],
    legend = list(
        inside = list(
            fun = draw.key,
            args = list(
                key = list(
                    points = list(
                        col = 'black',
                        pch = 22,
                        cex = 2,
                        # reverse order to match stacked bar order
                        fill = rev(default.colours(12, is.greyscale = FALSE)[11:12])
                        ),
                    text = list(
                        # reverse order to match stacked bar order
                        lab = rev(c('Nonsynonymous SNV','Other SNV'))
                        ),
                    padding.text = 3,
                    cex = 1
                    )
                ),
            x = 0.55,
            y = 0.95
            )
        ),
    # Changing the plot from a grouped plot to a stacked plot
    stack = TRUE,
    description = 'Barplot created by BoutrosLab.plotting.general',
    resolution = 200
    );
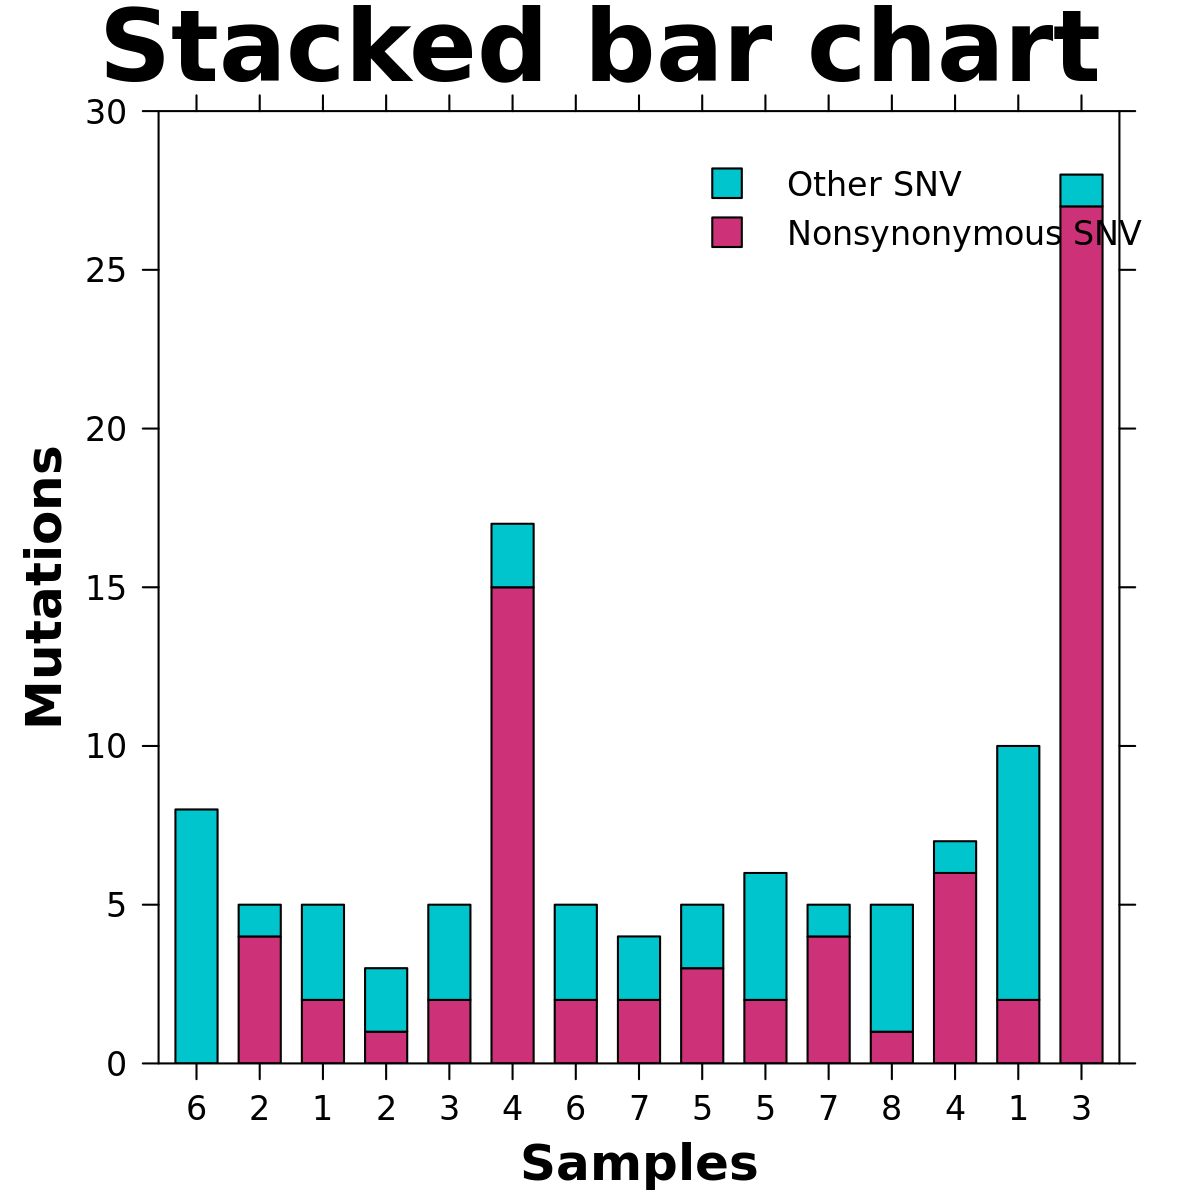
sample.order = 'decreasing'
create.barplot(
    filename = "stack_decreasing.png",
    formula = values ~ samples,
    data = barplot.data,
    main = 'Stacked bar chart',
    xlab.lab = 'Samples',
    ylab.lab = 'Mutations',
    ylimits = c(0,30),
    yat = seq(0,30,5),
    xaxis.cex = 1,
    yaxis.cex = 1,
    xlab.cex = 1.5,
    ylab.cex = 1.5,
    xaxis.fontface = 1,
    yaxis.fontface = 1,
    groups = mutation,
    col = default.colours(12, is.greyscale = FALSE)[11:12],
    sample.order = 'decreasing',
    legend = list(
        inside = list(
            fun = draw.key,
            args = list(
                key = list(
                    points = list(
                        col = 'black',
                        pch = 22,
                        cex = 2,
                        # reverse order to match stacked bar order
                        fill = rev(default.colours(12, is.greyscale = FALSE)[11:12])
                        ),
                    text = list(
                        # reverse order to match stacked bar order
                        lab = rev(c('Nonsynonymous SNV','Other SNV'))
                        ),
                    padding.text = 3,
                    cex = 1
                    )
                ),
            x = 0.55,
            y = 0.95
            )
        ),
    # Changing the plot from a grouped plot to a stacked plot
    stack = TRUE,
    description = 'Barplot created by BoutrosLab.plotting.general',
    resolution = 200
    );

sample.order = 'increasing'
create.barplot(
    filename = "stack_increasing.png",
    formula = values ~ samples,
    data = barplot.data,
    main = 'Stacked bar chart',
    xlab.lab = 'Samples',
    ylab.lab = 'Mutations',
    ylimits = c(0,30),
    yat = seq(0,30,5),
    xaxis.cex = 1,
    yaxis.cex = 1,
    xlab.cex = 1.5,
    ylab.cex = 1.5,
    xaxis.fontface = 1,
    yaxis.fontface = 1,
    groups = mutation,
    col = default.colours(12, is.greyscale = FALSE)[11:12],
    sample.order = 'increasing',
    legend = list(
        inside = list(
            fun = draw.key,
            args = list(
                key = list(
                    points = list(
                        col = 'black',
                        pch = 22,
                        cex = 2,
                        # reverse order to match stacked bar order
                        fill = rev(default.colours(12, is.greyscale = FALSE)[11:12])
                        ),
                    text = list(
                        # reverse order to match stacked bar order
                        lab = rev(c('Nonsynonymous SNV','Other SNV'))
                        ),
                    padding.text = 3,
                    cex = 1
                    )
                ),
            x = 0.55,
            y = 0.95
            )
        ),
    # Changing the plot from a grouped plot to a stacked plot
    stack = TRUE,
    description = 'Barplot created by BoutrosLab.plotting.general',
    resolution = 200
    );