Releases: wolfpld/tracy
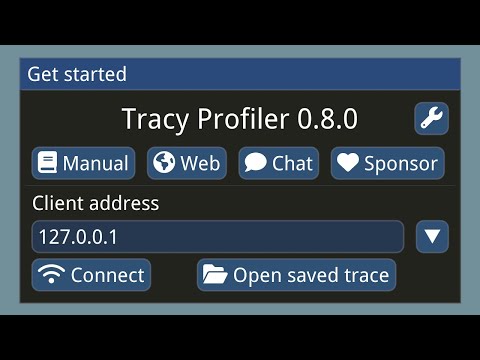
Tracy Profiler 0.8
Tracy Profiler 0.7.8
For a more detailed change list, see https://github.com/wolfpld/tracy/blob/v0.7.8/NEWS.
Child call times
Time spent in child function calls can be now optionally displayed in the symbol view window. Due to how programs are structured, time will be attributed to the next instruction (where the call will return).
General improvements to symbol view
Jump targets (typically out of screen) can be now also seen in tooltips.
Register access color codes are explained in tooltips.
Save options
When saving a trace you will be now able to select compression parameters. Previously this was only available through the update utility.
New GPU instrumentation options
- Vulkan contexts can be now calibrated on Linux.
- Direct3D 11 instrumentation is now supported.
Improvements to chrome tracing import
- Tracy can now import chrome traces compressed with Zstd.
- Custom source location tags are supported.
- Support for multiple PIDs has been added.
Tracy Profiler 0.7.7
For a more detailed change list, see https://github.com/wolfpld/tracy/blob/v0.7.7/NEWS.
Number of entry call stacks
Each sampled assembly line has a number of entry call stacks (unique execution paths leading to the instruction) assigned to it. This was previously accessible through the "sample entry call stacks" window, and it is now more exposed in a tooltip, along with a reminder which should increase discoverability of the aforementioned window.
Note: Entry call stacks were previously named "parent call stacks".
Source code preview
Source code contents will now have preview tooltips in various places in the UI. Keep in mind it's possible that the displayed source code might not be up-to-date. Please consult the user manual for the usual caveats.
Tracy Profiler 0.7.6
For a more detailed change list, see https://github.com/wolfpld/tracy/blob/v0.7.6/NEWS.
Executable timestamp
Timestamp of the profiled program is now stored in the capture.
Naming GPU contexts
Custom GPU context names can be now set through the Tracy*ContextName() macros.
Client-side source file transfer
Source file discovery and caching is now also performed on the client side, giving you insight into sources on remote hosts, without the need to manually copy them.
Updated libbacktrace
Most notably this fixes crashes due to memory corruption on macOS. Various other improvements were also made.
v0.7.5
Tracy Profiler 0.7.5
For a more detailed change list, see https://github.com/wolfpld/tracy/blob/v0.7.5/NEWS.
New tables UI
Tables displayed by Tracy can now have their columns reordered, hidden, or sorted both in ascending and in descending order (within reason). The column configuration is preserved between profiler sessions.
Chrome importer improvements
The chrome tracing importer will now properly set the trace name, which will be displayed on the profiler's title bar. Thread names, if present in the original capture, will also be converted.
Compatibility and bug fixes
Robustness of the profiler was increased by fixing some issues which previously flew under the radar, for example:
- System tracing on Android is now working in more software configurations.
- Localhost-only clients are now properly broadcasting their presence.
- Call stacks are now properly transferred for Vulkan events.
- OpenCL events will be now properly captured if some zones are inactive, or if the application was build without assert checks.
- The order of bytes in ARM machine code printout will now match the one printed by objdump.
v0.7.4
Tracy Profiler 0.7.4
For a more detailed change list, see https://github.com/wolfpld/tracy/blob/v0.7.4/NEWS.
Textual descriptions for assembly instructions
Some assembly instructions will now have descriptions, explaining what they do.
More microarchitectural data
Zen 3 and Cascade Lake measurements have been added.
Additionally, the profiler will now warn if the selected microarchitecture doesn't match the CPU on which the profiling was performed.
Ghost zone improvements
The source location dynamic zone coloring mode now also has an effect on ghost zones.
Namespace shortening has also been implemented for ghost zones.
Frame rate targets
You can now set a target FPS value, which you want to achieve, and get a visualization of which frames didn't met it, and how long the frame went over the target, presented as a red area.
v0.7.3
Tracy Profiler 0.7.3
For a more detailed change list, see https://github.com/wolfpld/tracy/blob/v0.7.3/NEWS.
Memory pools
Tracy can now track multiple memory pools.
Instrumentation failure tracking
In some cases of instrumentation failure, a call stack showing where it has happened will be displayed.
Client presence improvements
When the profiled application accepts connection from the server, or when it exits, it will now send a notification that it is no longer available. This removes lingering entries in the discovered clients list.
Linux improvements
Added support for DPI scaling and Wayland.
v0.7.2
Tracy Profiler 0.7.2
This release mainly contains minor quality-of-life improvements. For a more detailed change log, see https://github.com/wolfpld/tracy/blob/v0.7.2/NEWS.
Update notifications
Tracy will now check if updates are available.
Variable zoom level during capture tracking
When the profiler is following the most recent events in the capture you can now zoom out (or in), instead of only being able to keep track of the most recent three frames.
v0.7.1
Tracy Profiler 0.7.1
Here are some highlights for Tracy Profiler 0.7.1. For a more detailed change list, see https://github.com/wolfpld/tracy/blob/v0.7.1/NEWS.
Linux sampling support
Call stack sampling, previously available only on Windows is now also implemented on Linux:
This includes sampling on Android devices:
Time limit ranges
Results displayed in the find zone and statistics windows can be now narrowed down to a specific time range. One of the ways a time range can be specified is through the newly added context menu system:
Time ranges can be freely adjusted using the mouse:
Automatic Vsync capture on Windows
This shows when the hardware vertical synchronization happens for each of the monitors:
Zone name grouping
Another way of grouping zones in the find zone window.
Display of exact time in capture
You can now hover the timescale to see an exact timestamp since the beginning of the capture.
v0.7
Release 0.7.0.


