- Varun Gogate - Repo, Database, Vis
- Kit Williams - Machine Learning, Vis
- Sakile Trowers - Vis, Database
- Zach Mehlenbacher - Framework, Database, Vis
Project Question: Can Vegas odds and historical scores amongst all NBA games from a full season be used to detemine the accuracy of the lines produced by sports betting webistes, such as their MoneyLine, Game Spreads, and Over/Unders.
Our dataset was discovered through Kaggle, https://www.kaggle.com/datasets/erichqiu/nba-odds-and-scores.
- The dataset was cleaned using Python and neccesary libraries (Pandas, Numpy, etc)
- Utilize Mongodb Atlas database for housing data and tracking log of user inputs.
- Develop Machine Learning models to predcit the Money Line, Spread and Over/Under.
- Create API Endpoints using Flask to connect our Webpage, Database, and Machine Learning Scripts.
- Dashboard framework built using Bootstrap and Plotly where our visualizations will deploy the model outputs.
General data cleaning was needed to reduce the complexity and dimensions of the data set. Redundant/Unneeded columns were deleted and we ensured every column was the correct data type. Since we planned on using a binary classifier, 3 target columns were calculated (one for each prediction) where the value was either a 1 for correct or 0 for incorrect. These columns for the target variables were added to the end of our dataframe.
Once the data was cleaned we then went through a process of feature selection to determine which variables contributed to an accurate prediction of our target variable. The features for the model were selected by determining correlation metrics for all of the columns. A plot of 2 features were plotted against each other and colored by whether the outcome was 1 or 0. This was done for every combination of columns for the 3 different models. Graphs that showed a clear correlation were selected to train the model.
With the features selected, some final preprocessing occurred before fitting our model. Categorical variables were converted to numeric and all the columns were scaled using the Standard Scaler.
The dataset contains 2452 rows. The data was split into training and testing sets using the SciKit learn train_test_split method.
A neural network was selected to predict our target variables. We made 3 different neural networks, one for each target variable. Based on the feature selection process, the best correlated columns were used as inputs to the models (which varied)from 7 - 10 inputs). The benefits of using the neural network is that it is very customizable to try and optimize performance. Our topic is inherently difficult to predict so any prediction above 50% is better than guessing. We currently have an accuracy that ranges from 48.5% - 70.2% and we are looking to improve this number. Another benefit is that our data is scalable, we can include additional years of data as well as merge team data to the data frame. These options will be explored to try and increase the model’s accuracy. A limitation to the model is that optimizing the performance will require a lot of trial and error working with the number of hidden layers and neurons. In addition, there could be a possibility of overfitting the data so this must be considered when trying to improve the model.
Key points and Features: • Database connection to ML model --> PyMongo will be utilized to connect our DB to our Python ML Model. • User Input and DB connectivity --> An input table was created to store selections and connected through an app.py file. • Advantages of using MongoDB: Ease of connectivity through PyMongo and set up | Data accessibility through web-based Atlas application
After training the 3 models, their prediction accuracies were determined using the testing data...
MoneyLine Prediction Accuracy: 70.2%
Spread Prediction Accuracy: 53%
Over/Under Prediction Accuracy: 48.5%
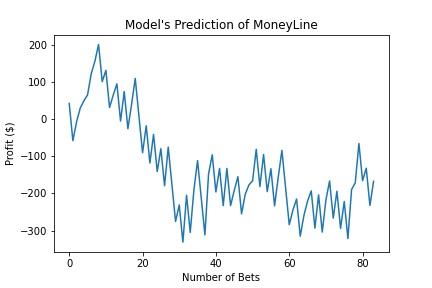
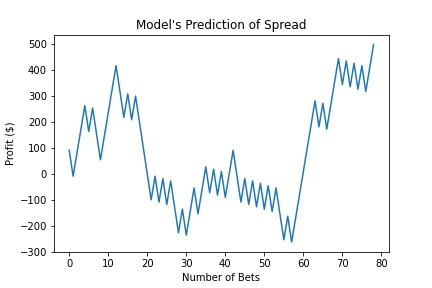
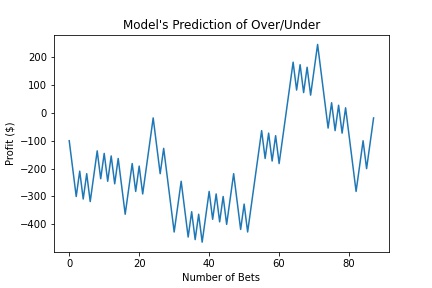
In order to test our model on real life data, we applied the models to predict the outcomes of the 2022 NBA Playoff games going on. The dataset of every playoff game thus far was fed into the models and they made predictions on certain games.
The Activation Function on the Output layer is a Sigmoid. So all outputs of our models will range from 0-1. Initally, we decided to test the models whenever the model predicted greater than 0.5 (50%) because this would mean its predicting better than a random guess.
The resulting figures show the outcomes of betting on the games the models predicted.
Net Return: -$167.67
Net Return: $500.00
Net Return: -$18.18
Overall Return Using a Threshold of > 50%:
Wagered: $25,100
Earned: $314.15
Return on Investment: 1.25%
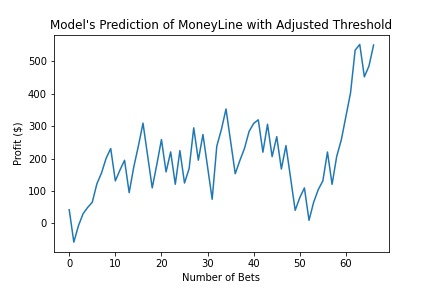
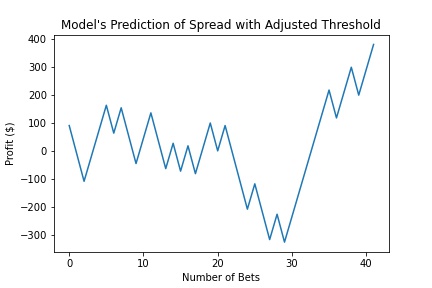
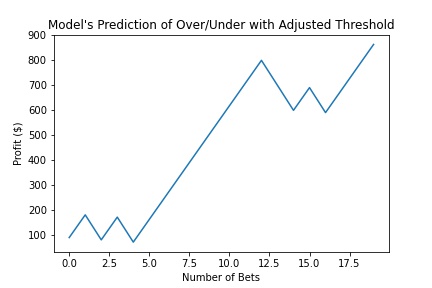
We then looked to improve upon these results. With the models already trained, we decided to fine tune the thresholds of when the model tells you to place a bet. We adjusted each model's threshold and find the most optimal outputs. These graphs are shown below.
Net Return: $550.66
Net Return: $381.82
Net Return: $863.64
Overall Return Using Tuned Thresholds:
Wagered: $12,900
Earned: $1,796.12
Return on Investment: 13.92%
This shows that if you fine tune the model, you are able to earn almost 6 times the profit by even wagering less than half the original amount. The Return on Investment also increase 12.67%.
Google Slides and general outline for Presentation can be found here:
https://docs.google.com/presentation/d/1pg1xgsjBsOmQrMdxlT2wFP6VxVbv49QSj2FkXTKnR-k/edit?usp=sharing
