INSY 695 Group 3 - Airline Passenger Satisfaction Prediction
https://www.kaggle.com/datasets/teejmahal20/airline-passenger-satisfaction?select=train.csv
This project is a continuation of the original airline customer satisfaction project which focuses on deriving insights from the customer satisfaction dataset in order to understand the key attributes that contribute most to customer satisfaction.
- Descriptive Analysis of Data.
- Data Modelling to Predict Customer Satisfaction.
- Define KPI (Satisfaction Ratio) and analyse previous results to maximize it.
- Create Dashboard to summarize results
- Do Further Causal Inference
- Data leakage analysis
- Imbalanced classification check
- Model overfitting check
- Model tuning using TPOT and H20
- Hyperparameter tuning using Hyperopt and Optuna
- Unsupervisied learning - KNN
- Model explainability using SHAP
- Model serving using FastAPI and Docker containers
- CICD using Github actions
- Drift analysis
- Dynamic data monitoring
- Cleaning column names
- Identify categorical columns and numerical columns
- Check missing values
- Check Distribution of Target Variable
- Check Distribution of Numerical Variables with respect to Target Variable
- Check Distribution of Categorical Variables with respect to Target Variable
- Check Relationships between categorical variables
- Handling Categorical Variables (Ordinal Encoding on 'Class',One Hot Encoding)
- Check Correlations and remove highly correlated feature
- Handling missing values with SimpleImputer
- Remove Outliers
- LigtGBM model with tuned hyperparameters using Hyperopt was chosen as the best model with an accuracy of ~97% on the test set

- Significant drift detected in data based on the synthetic data generated using CTGAN library (see image below)

- The synthetic data was generated using the process described below
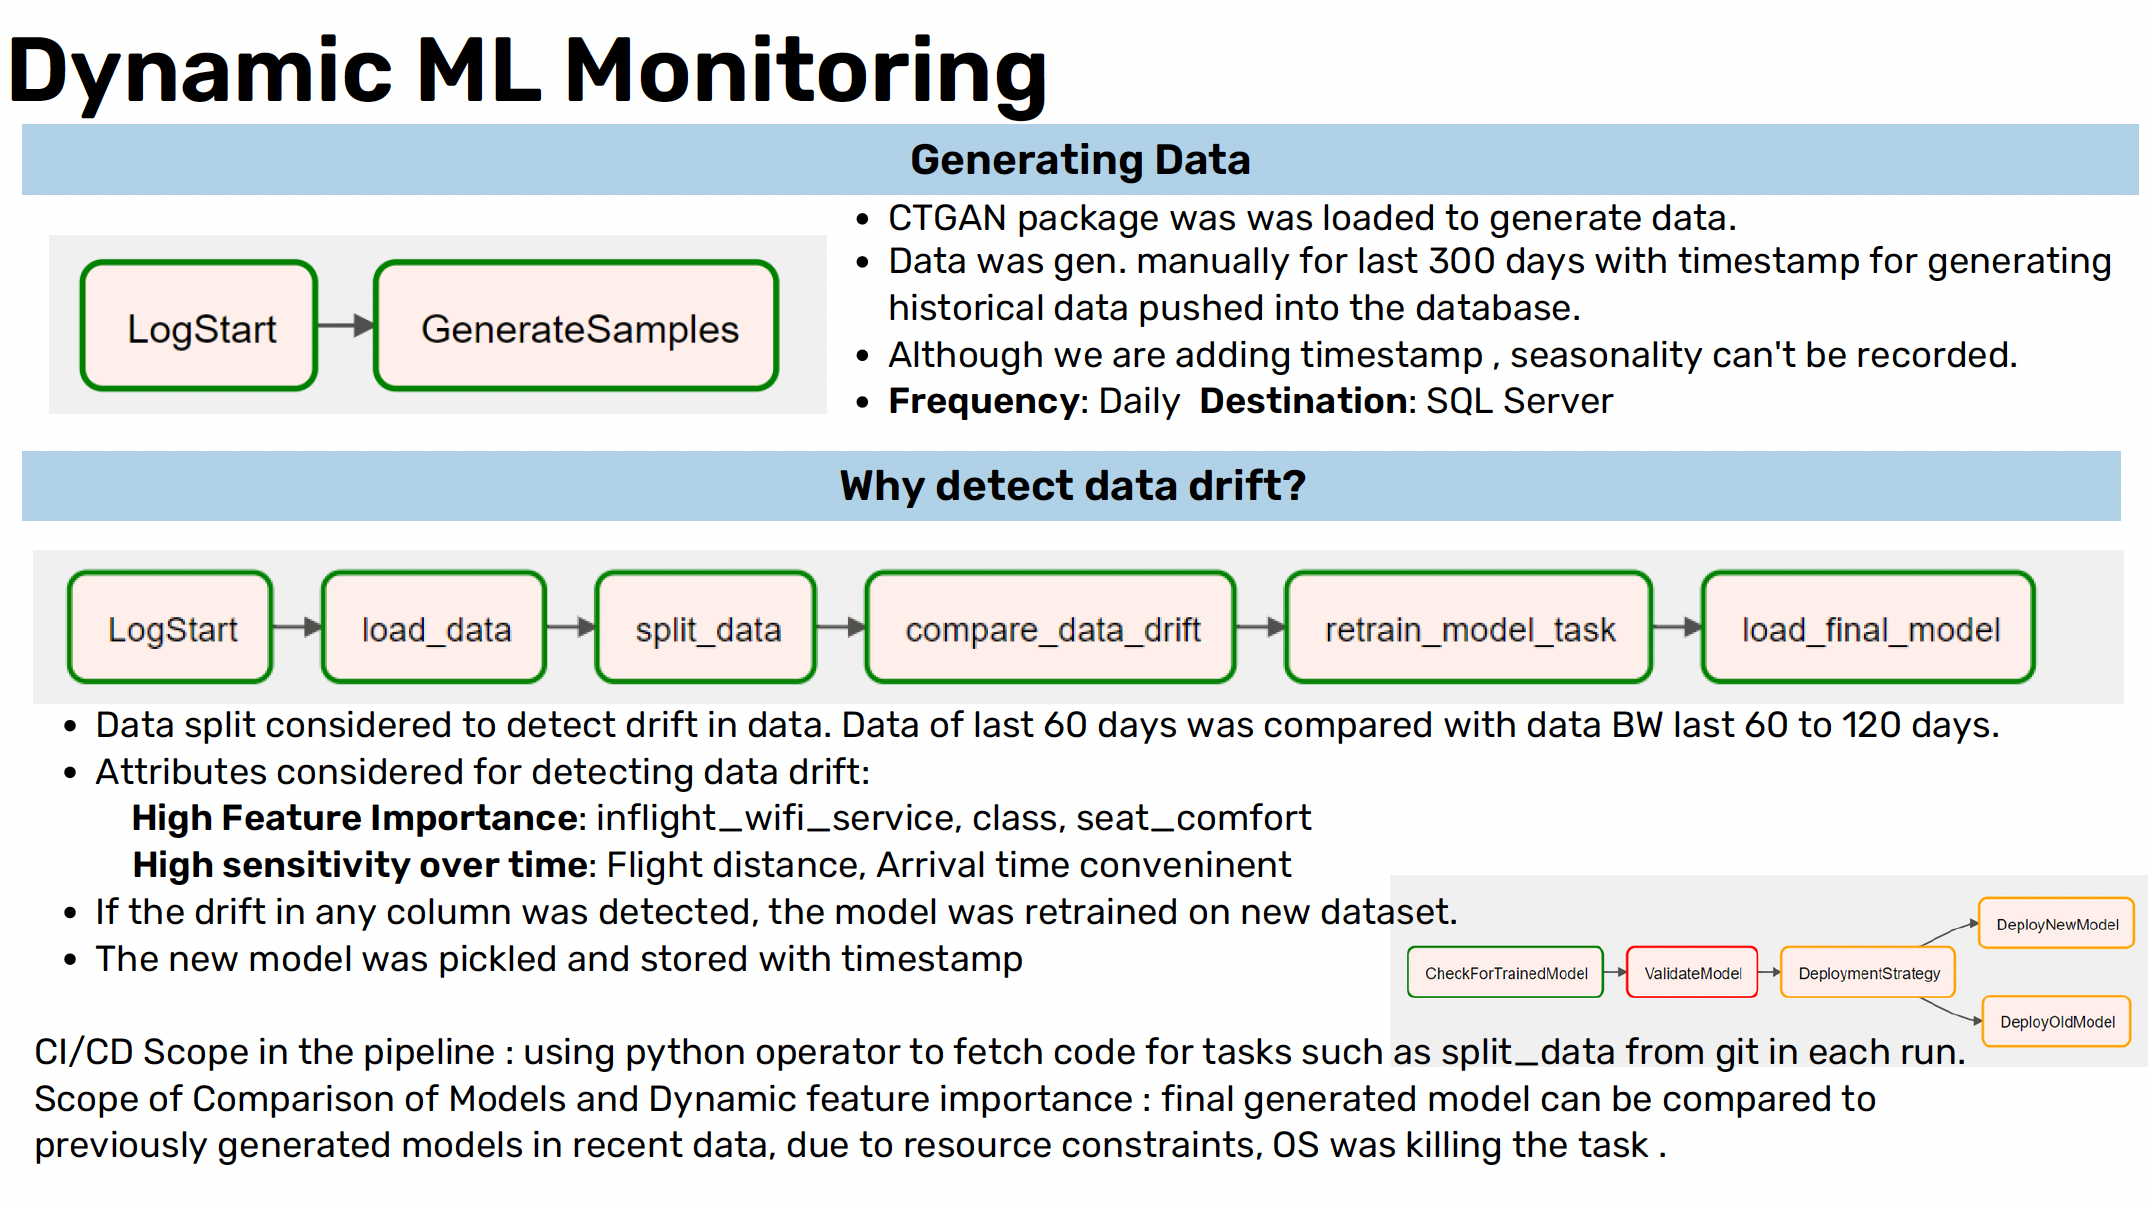
- For CICD, when push to the main branch, a workflow will be triggered that will pick the pickled model, rebuild and push the docker file to Heroku and Docker Hub


Power BI dashboard:

- We want to increase customer satisfaction rate, but need to define a single metric that we want to focus on
- New KPI is Satisfaction Ratio = Satisfaction / (Satisfaction + Neutral or NO Satisfaction )
- We look at the relation between this KPI and important features of the most accurate model.
- Analyse the Relation between Flight Distance and Satisfaction Ratio


We can see that the satisfaction ratio is lower in low distance flights, so our maximum focus should be on them.
- Analyse Relation between Inflight_wifi_service and Satisfaction Ratio


We see that the satisfaction ratio increase with better wifi service, therefore we should focus towards providing better wifi service.
- Analyse the Relation between Departure Delay and Satisfaction Ratio


We can see that the satisfaction ratio decreases as the departure delay increase, we should try to reduce the delay
- We are interested in which features of the flight would cause customer satisfactory / unsatisfactory. Hence we will not consider information about Customer: 'Age', 'Gender_Male', 'Customer_Type_Loyal Customer', Class: 'Class' and 'Type_of_Travel_Business travel'. 'Flight_Distance', 'Departure_Delay_in_Minutes': Most of the time it is out of our control.
- For each feature, we want to answer the question "What if we provide better service for this feature, will my satisfaction level increase?" We consider a rating larger than 3 as good enough service, and a rating less or equal than 3 as need to improve.
- Convert all features into boolean
- Check Feature Importance - We want to see if the feature with high feature importance actually has high causal effect as well
- Implement S-Learner using XGBCLassifier
- Implement S-Learner using LGBMCLassifier
- Implement T-Learner using XGBCLassifier
- Implement T-Learner using LGBMCLassifier
- Implement X-Learner using XGBClassifier
- Implement X-Learner using LGBMCLassifier

The learners' results are nearly identical, with Online_boarding showing the greatest ATE, trailed by Leg_room_service and Inflight_wifi_service. To boost customer satisfaction, the airline ought to concentrate on enhancing its performance in these areas of service.
Dreama Wang - 261112206
Nishi Nishi - 261078870
Riley Zhu - 261094733
ShanShan Lao - 261072808
Vibhu Bhardwaj - 261113187
Utkarsh Nagpal - 261071466
Mathilda Zhang - 261112212
Haoying Xu - 261109413
Oscar Montemayor - 261082079
