To generate all figures and analyses, just type make. Figures will be saved in
the "figures" directory, and summaries of analyses in the "results" directory.
- GNU Make
- Python 2 with the following libraries:
- numpy
- matplotlib
- mpltools
- the vegan R package (available from CRAN)
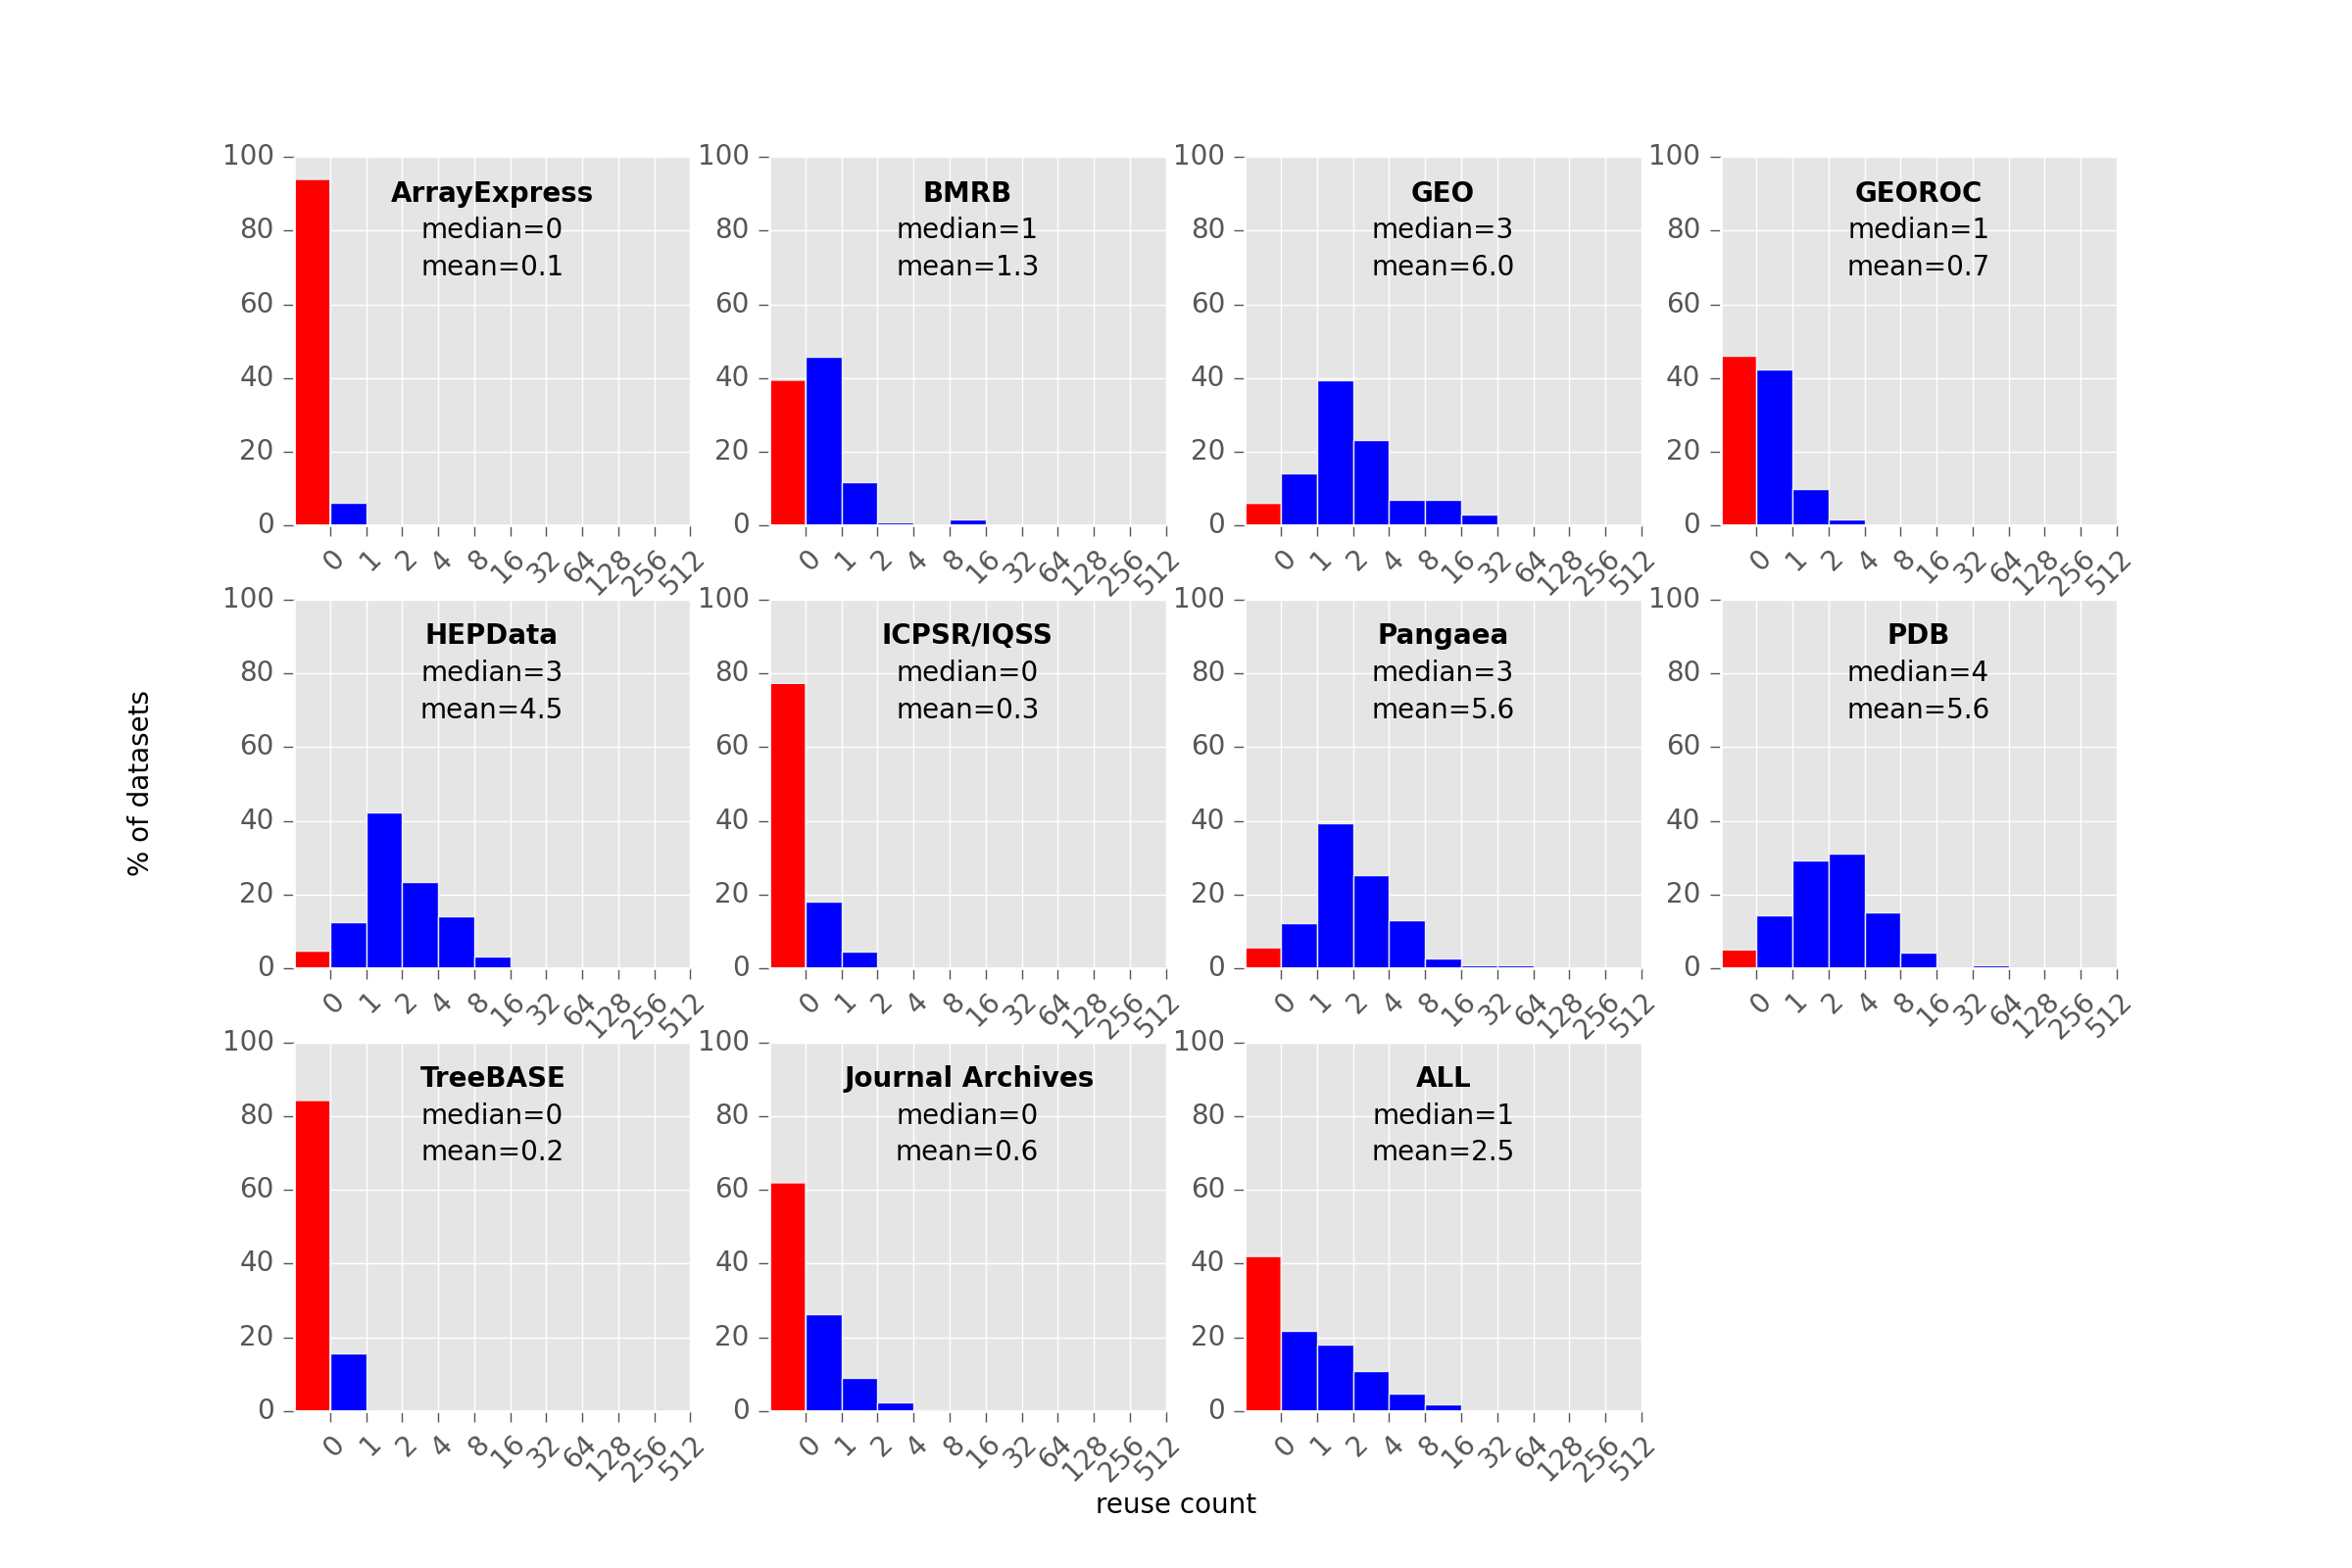
Histogram showing frequency of datasets with a given number of citations. Red bar indicates no citations.
The top 100 datasets by number of times reused, and the repositories they come from.
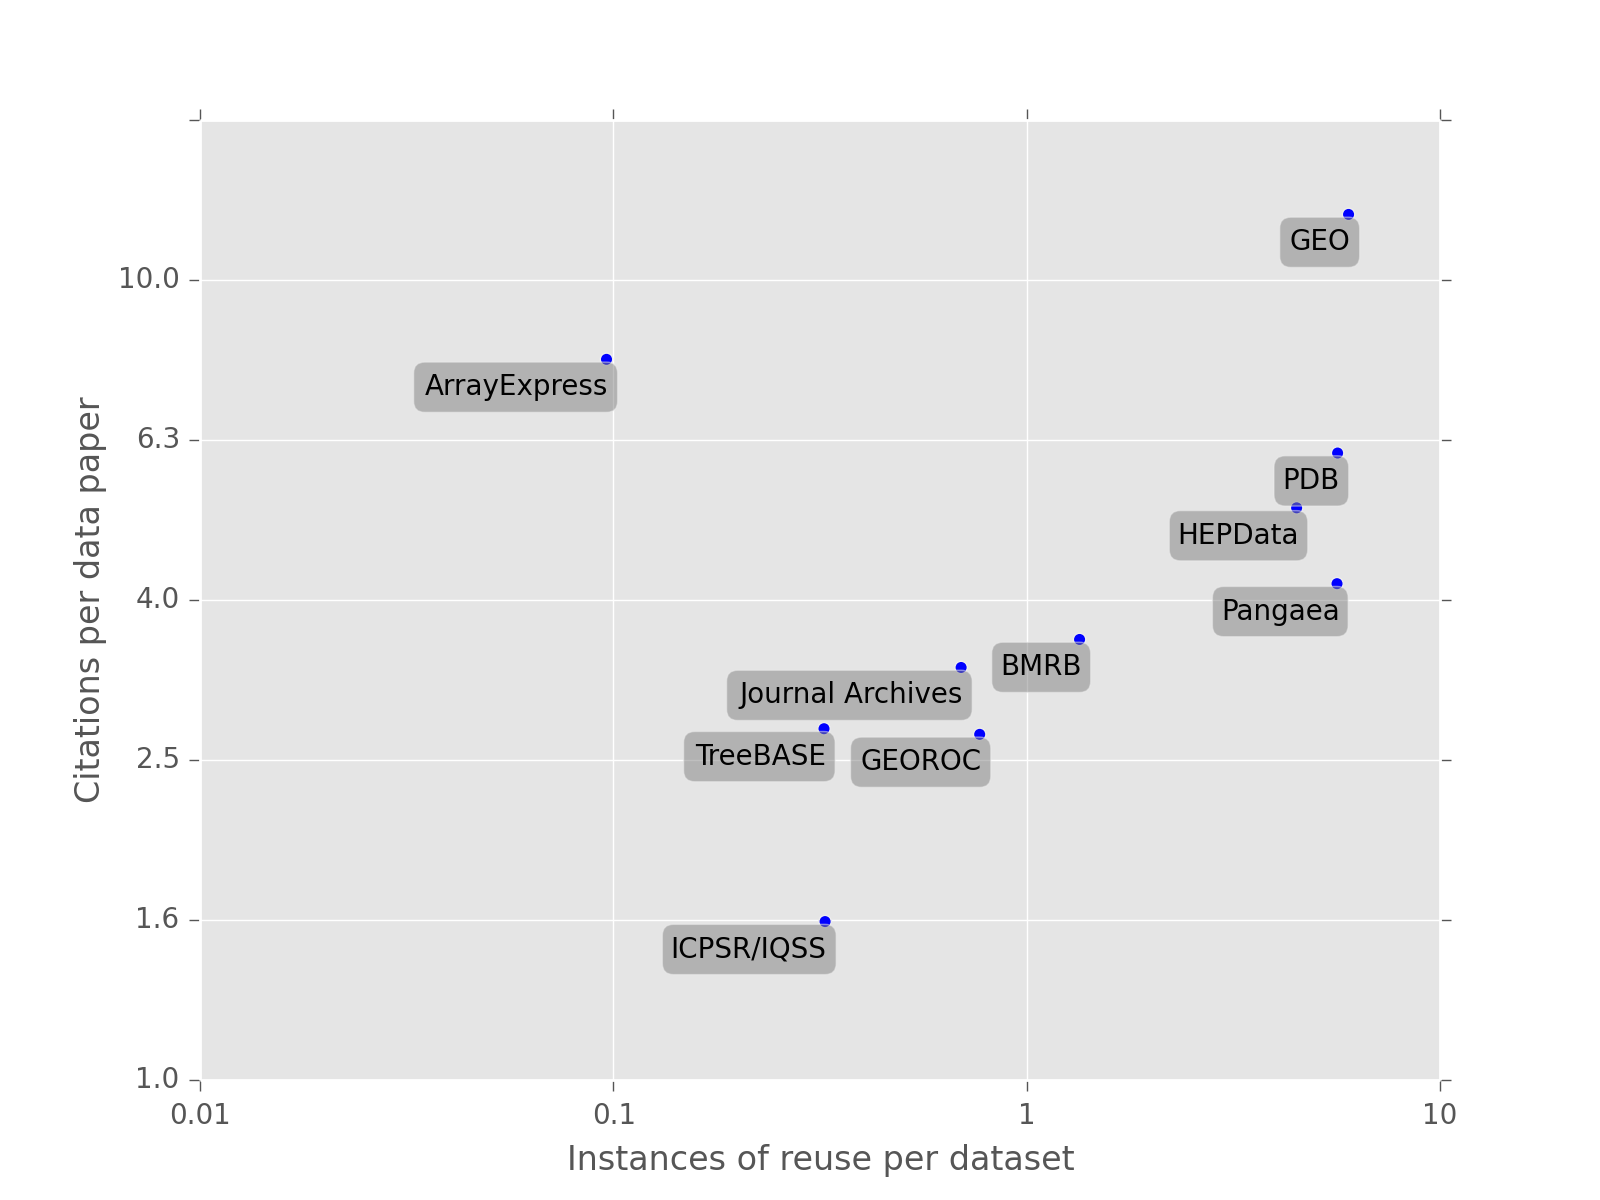
A comparison of per-dataset citation and reuse rates between repositories.
Instances of reuse for a dataset. Shows median and 50%/95% confidence intervals.


