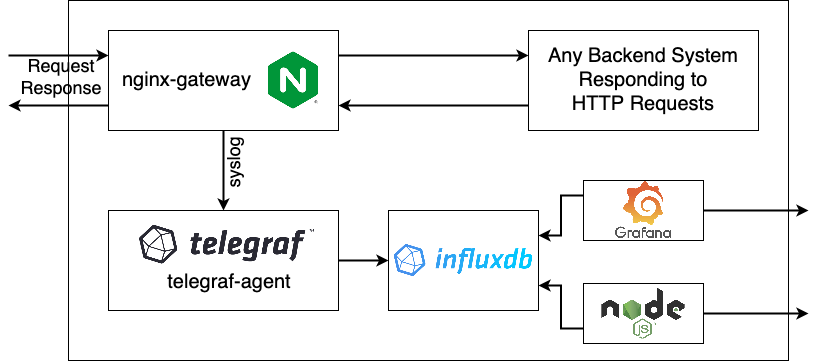
Monitors different endpoints using nginx and stores information about request response time in influxdb. The stored information would be available using an API and a dashboard.
nginx-gateway
telegraf-agent
example
Acts as gateway for endpoints. Pass the requests to the backend as revers proxy server. The backend is specified by PROXY_PASS_URL environment variable. Also, sends information about each request to the telegraf agent using syslog at TELEGRAF_SYSLOG_SERVER. The provided information are as follow using InfluxDB line protocol.
duration=$request_timestatus=$statusuri="$request_uri"method="$request_method"ust=$upstream_response_timeusc=$upstream_connect_time
Also, time is reported using $time_iso8601 at the end of the line. This is not a valid format for InfluxDB line protocol. But it will be changed at telegraf-agent syslog Parser before sending to influxdb.
Specify the port which nginx listen to for incoming traffic using environment variable PORT.
This is what syslog Parser at telegraf-agent gets:
<190>Dec 16 04:21:13 nginx: request_info,provider=nginx,uri=/auth/login,method=GET duration=0.004,status=404,ust=0.003,usc=0.003 2020-12-16T23:27:37+00:00
and this is what it returns: (a valid InfluxDB line protocol example)
request_info,provider=nginx,uri=/auth/login,method=GET duration=0.004,status=404,ust=0.003,usc=0.003 1608161257000000000
The metrics reported as syslog format by nginx-gateway. Telegraf has it's own inputs.syslog but it only supports syslog RFC 5424. Nginx syslog format is RFC 3164. There might be a way to convert these two easily but I ended up creating syslog Parser to convert syslog to InfluxDB line protocol. The source code is available at telegraf-agent/get_logs.go. It listens to port SYSLOG_SERVER_PORT environment variable and expects UDP packages in the format specified in [###sample-syslog-report]. It simply remove the first part of syslog message and changes the format fo the timestamp.
Telegraf inputs.execd runs this code and uses the stdout to send metrics to influxdb. It also reports inputs.nginx to influxdb gathered from NGINX_DEFAULT_STATS_URL environment variables.
The only metrics which are reported are the ones coming from nginx-gateway and /nginx_status. If you need to add more metrics edit the telegraf.conf file.
This repo is using influxdb_v2 and uses these environment variables to authenticate and connect to influxdb.
INFLUXDB_URLINFLUXDB_BUCKETINFLUXDB_TOKENINFLUXDB_ORG
For more info about the influxdb.
