

Table of Contents
This project was based on the work by @Adoni5 and his repository pyryotype. It was made to provide similar functionality to what is being offered by KaryoploteR package, but in a more pythonic style, using Matplotlib as the basis, and giving the user full liberty to plot anything they want.
pip install karyopyploterfrom karyopyploter import (
GENOME,
plot_ideogram,
make_ideogram_grid,
make_genome_grid,
annotate_ideogram,
add_ideogram_coordinates,
reset_coordinates,
zoom,
)
from matplotlib import pyplot as plt
from itertools import chain
from pathlib import Path
OUT_DIR = Path(__file__).parent.parent / "example_outputs" / "readme_example"
OUT_DIR.mkdir(parents=True, exist_ok=True)
genome = GENOME.CHM13
fig, axes = plt.subplots(
ncols=1,
nrows=22,
figsize=(11, 11),
facecolor="white",
)
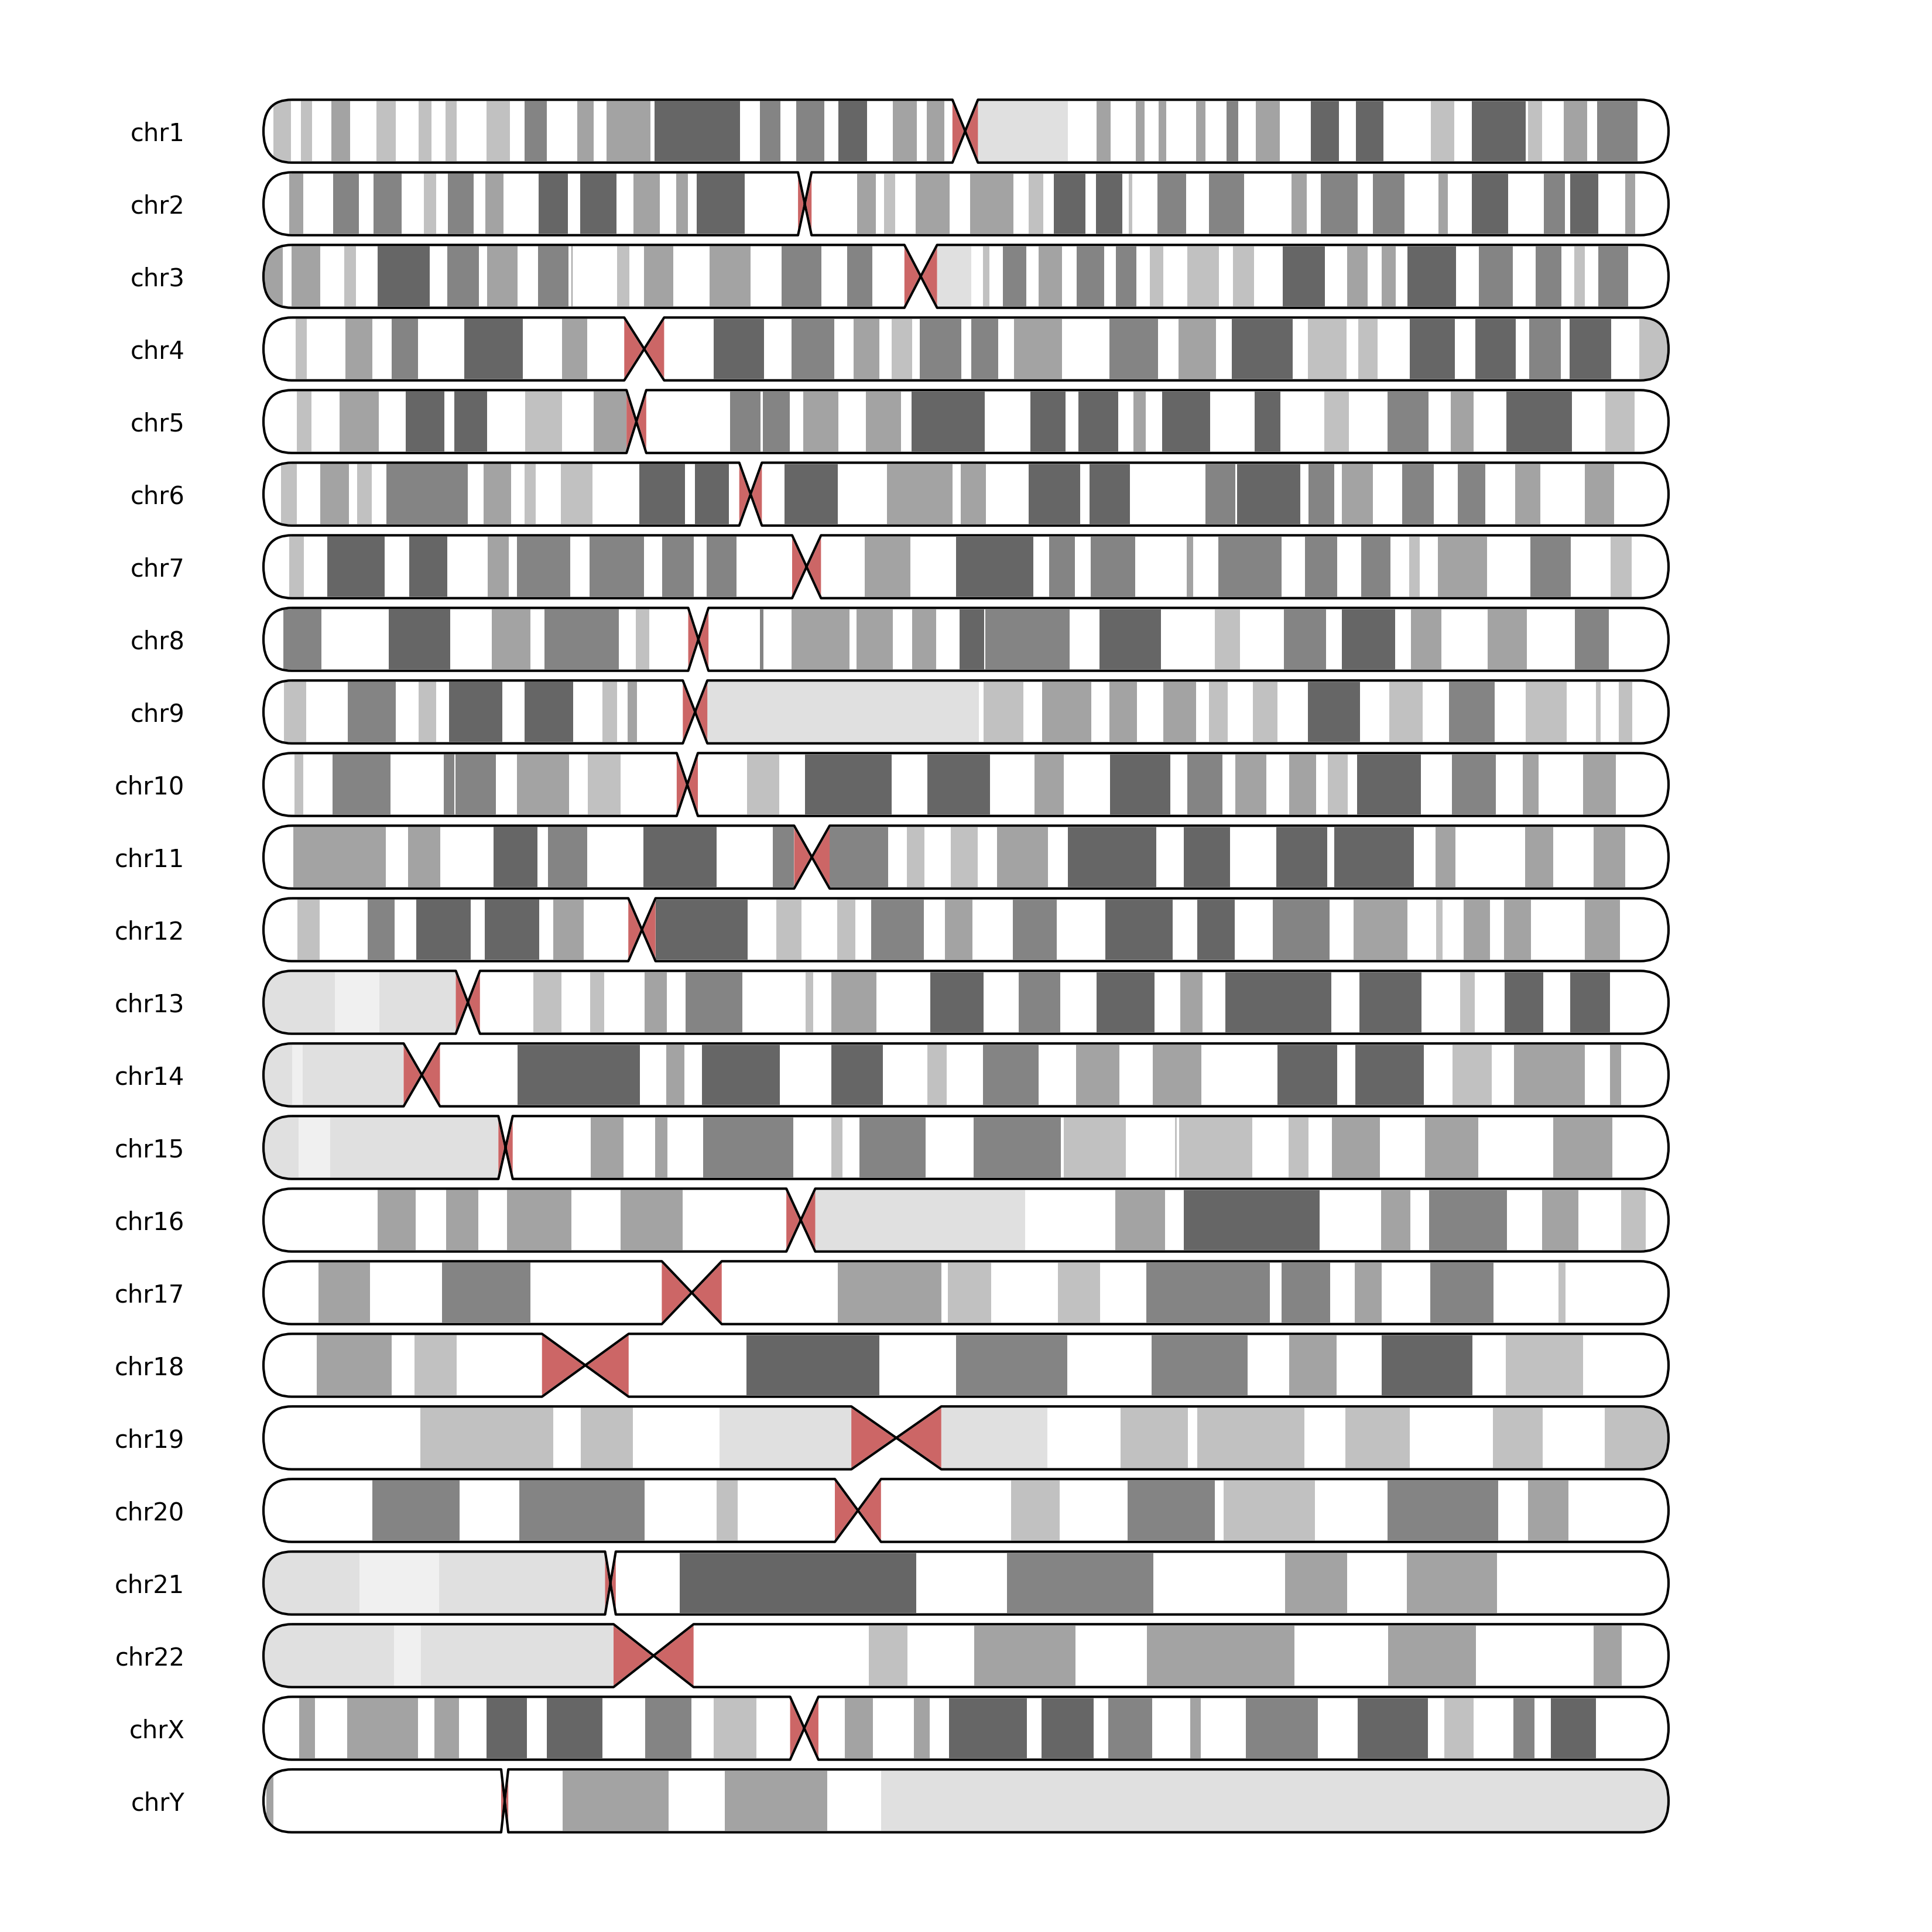
for ax, contig_name in zip(axes, [f"chr{i}" for i in chain(range(1, 23), "XY")]):
chromosome = contig_name
plot_ideogram(ax, target=chromosome, genome=genome, label=contig_name)
# similar to:
fig = plt.figure(figsize=(11, 11), facecolor="white")
fig, _, ideogram_axes = make_ideogram_grid(
target=[f"chr{contig_name}" for contig_name in chain(range(1, 23), "XY")],
num_subplots=0,
genome=genome,
fig=fig,
)
fig.savefig(TEST_DIR / "ideogram_grid1.png", dpi=300)Will output:
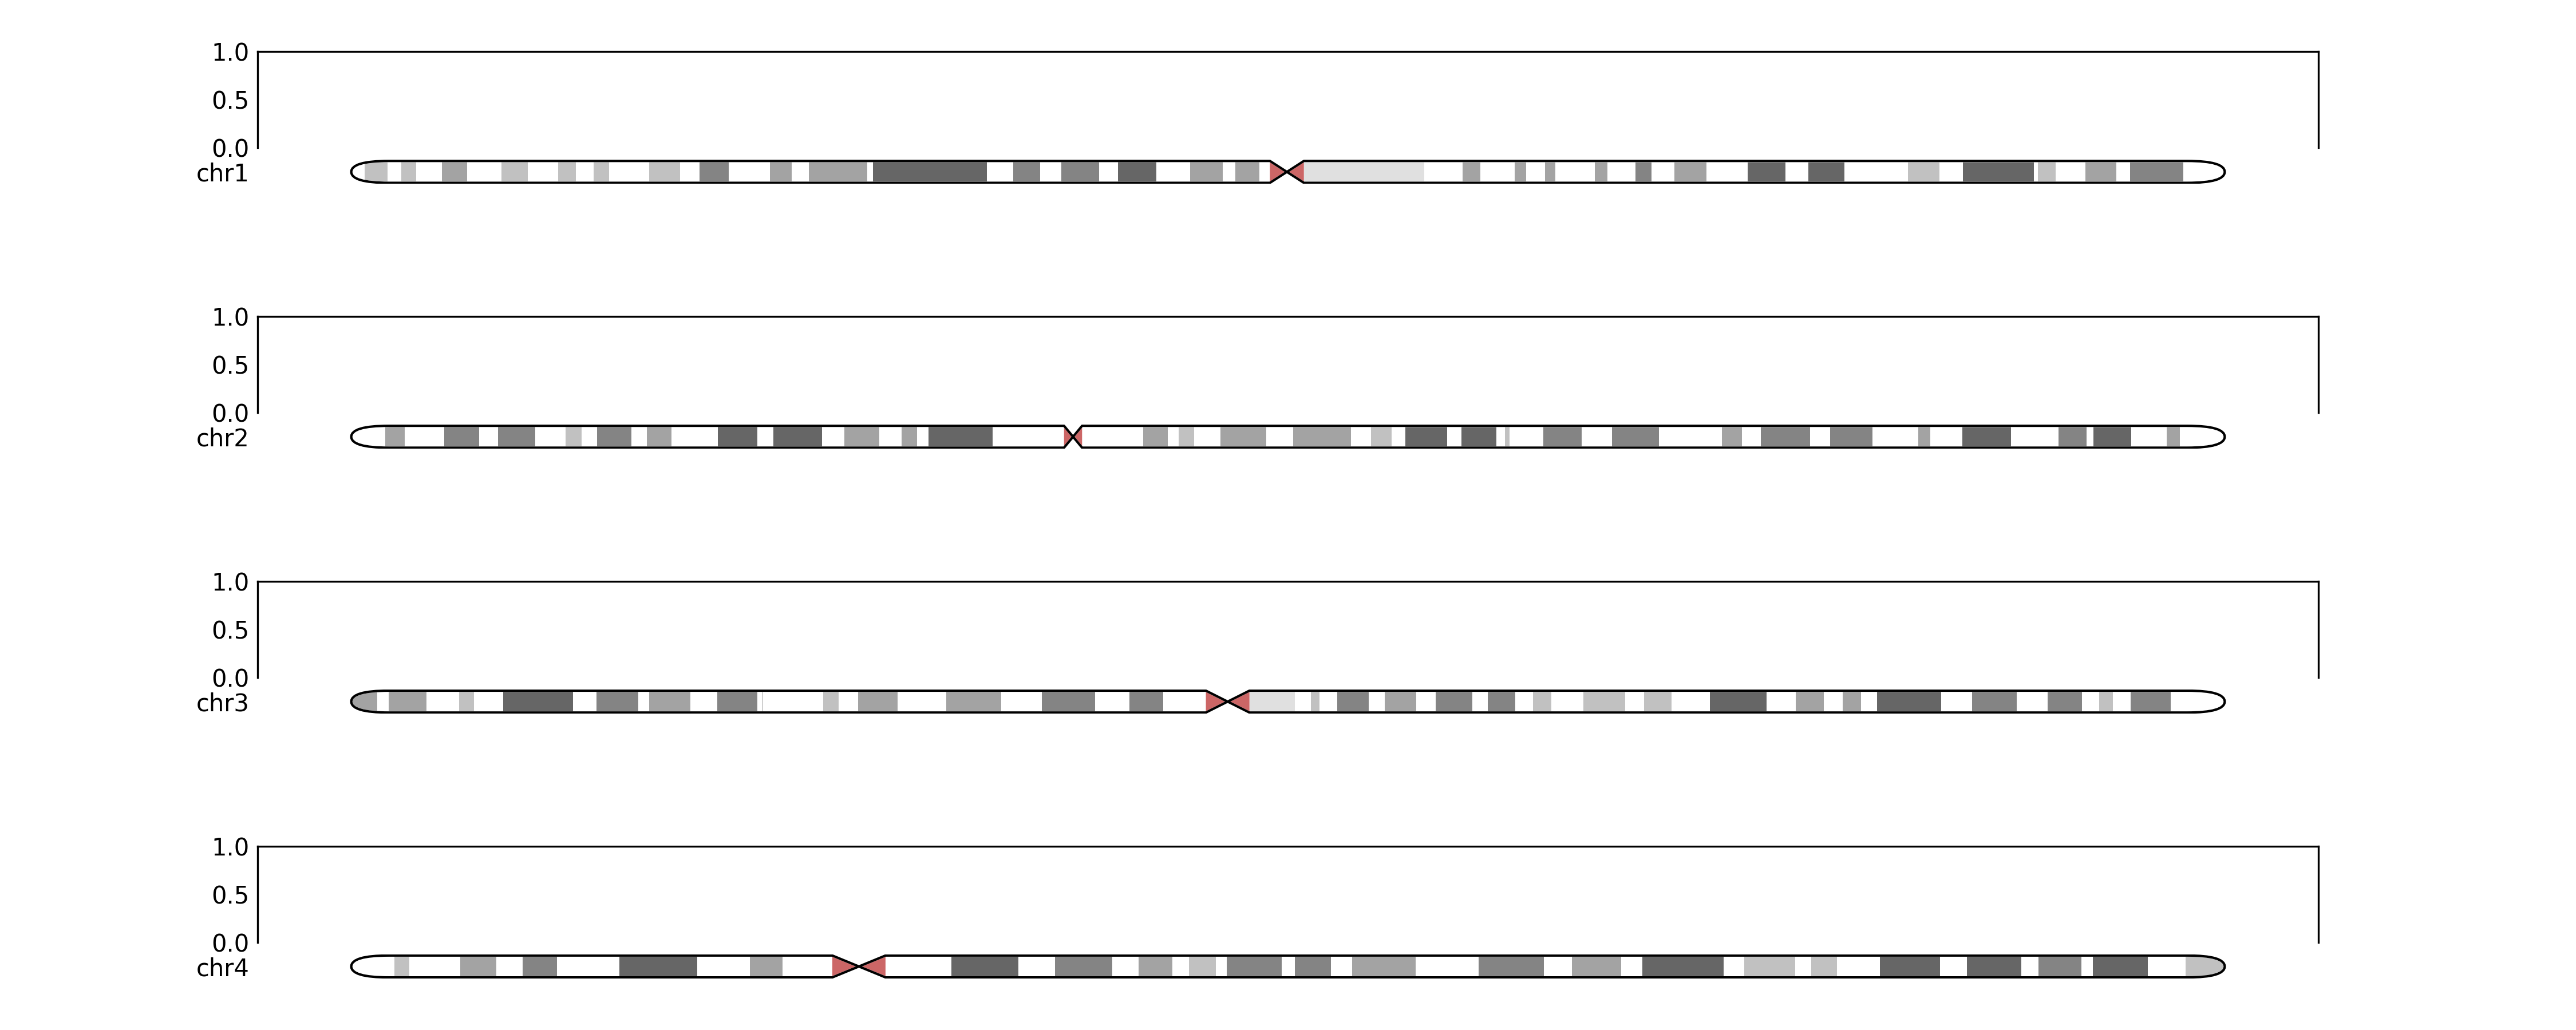
# and with a subplots grid
fig, ax, ideogram_axes = make_ideogram_grid(
        subplot_width=15,
        grid_params=dict(hspace=1),
        ideogram_factor=0.3,
        target=[f"chr{contig_name}" for contig_name in chain(range(1, 5))],
        num_subplots=1,
        genome=genome,
    )
fig.savefig(TEST_DIR / "ideogram_grid2.png", dpi=300)
Will output:
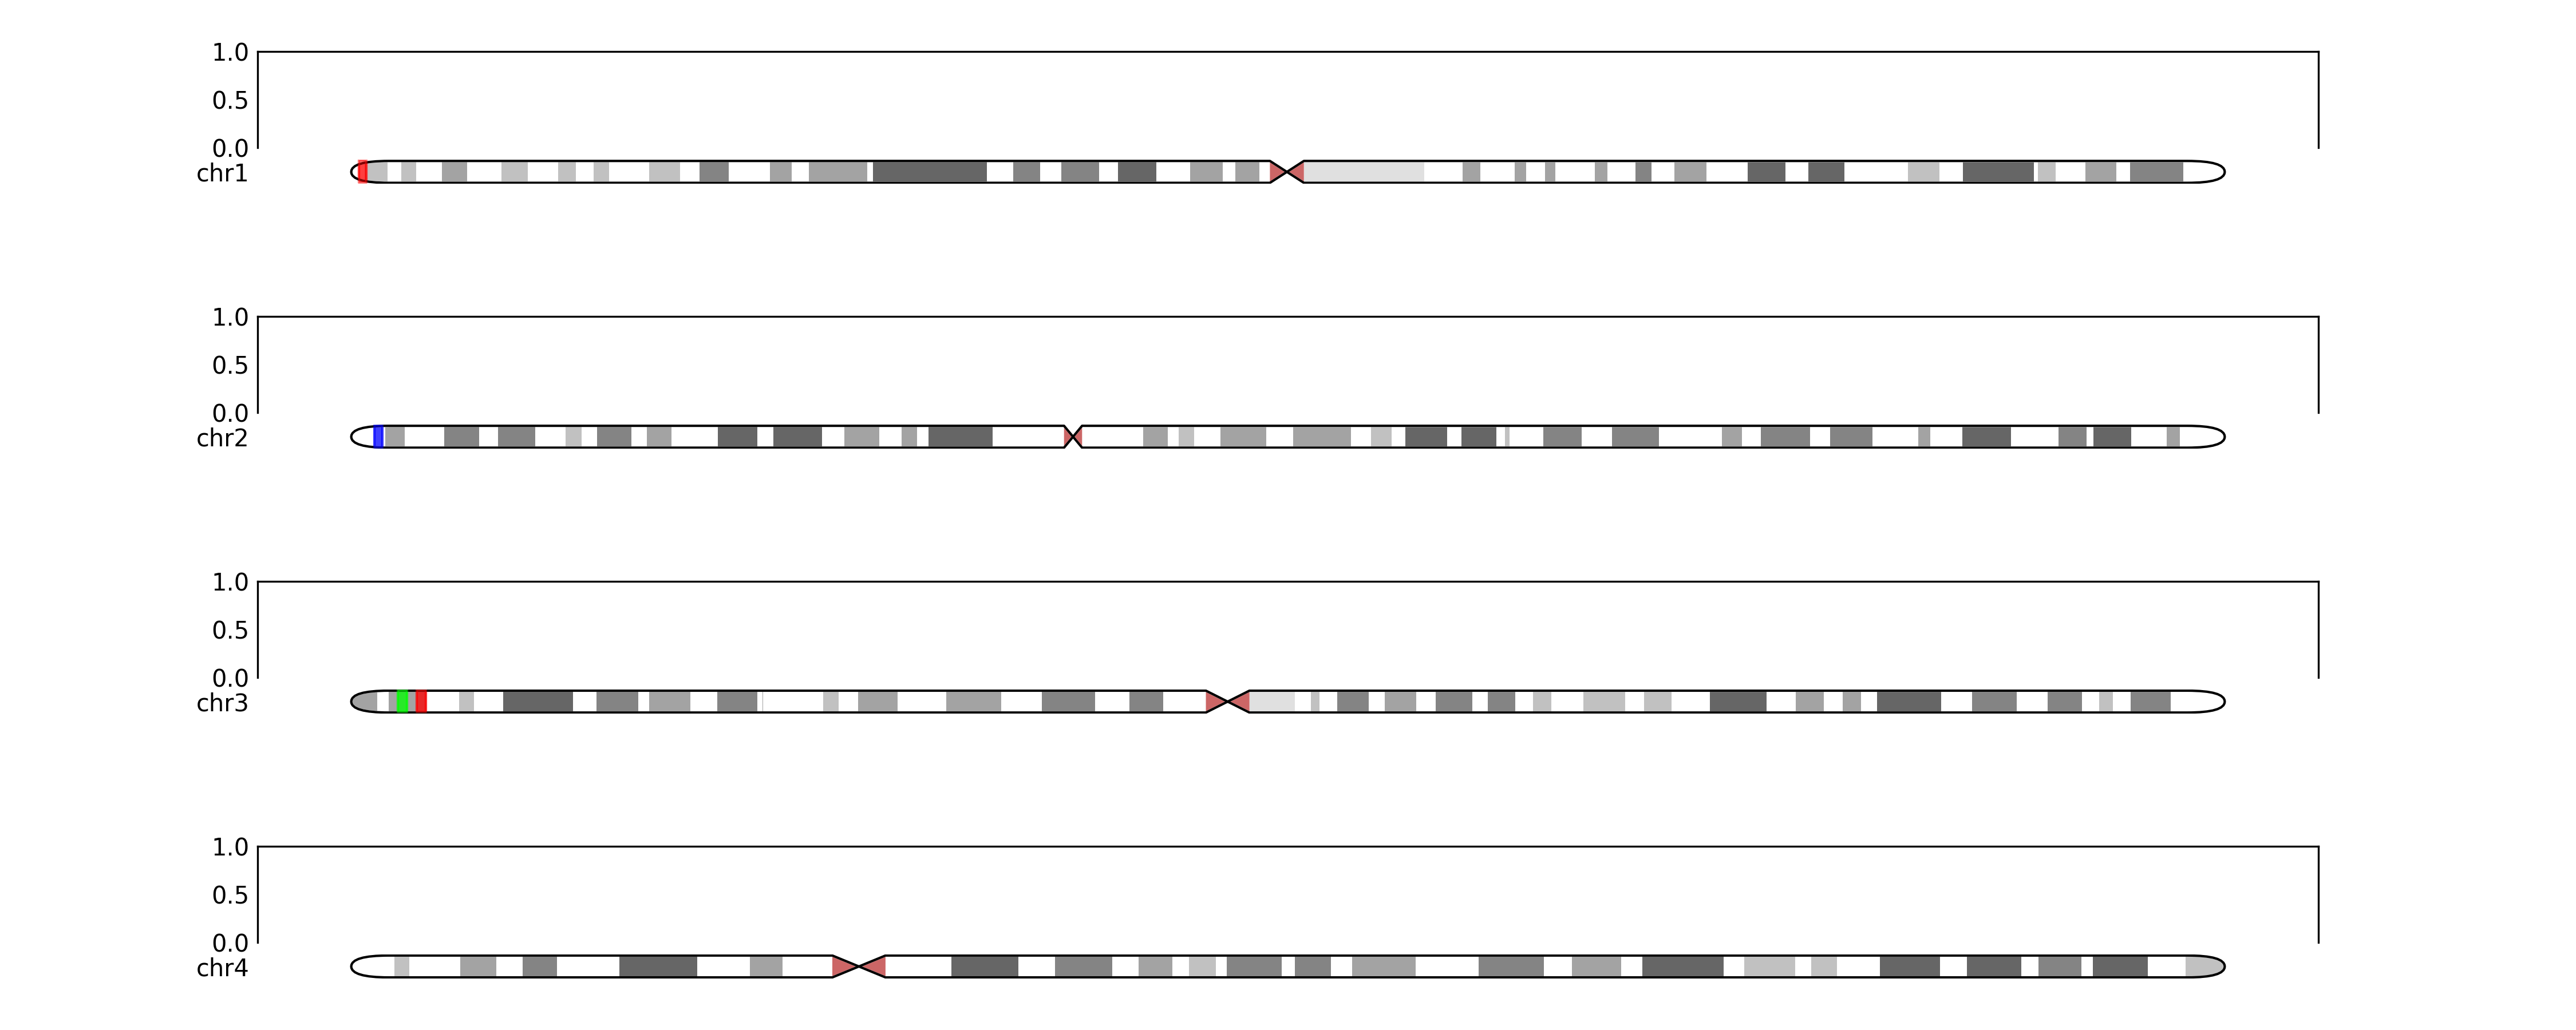
# and with some regions annotated
regions = {'chr1':[(1000000,2000000, "red")], 'chr2':[(3000000, 4000000, 'blue')], 'chr3':[(5000000,6000000, (0,1,0)), (7000000,8000000, (1,0,0))]}
for chr in regions:
        annotate_ideogram(ideogram_axes[chr], regions=regions[chr], genome=genome)
fig.savefig(TEST_DIR / "ideogram_grid3.png", dpi=300)
Will output:
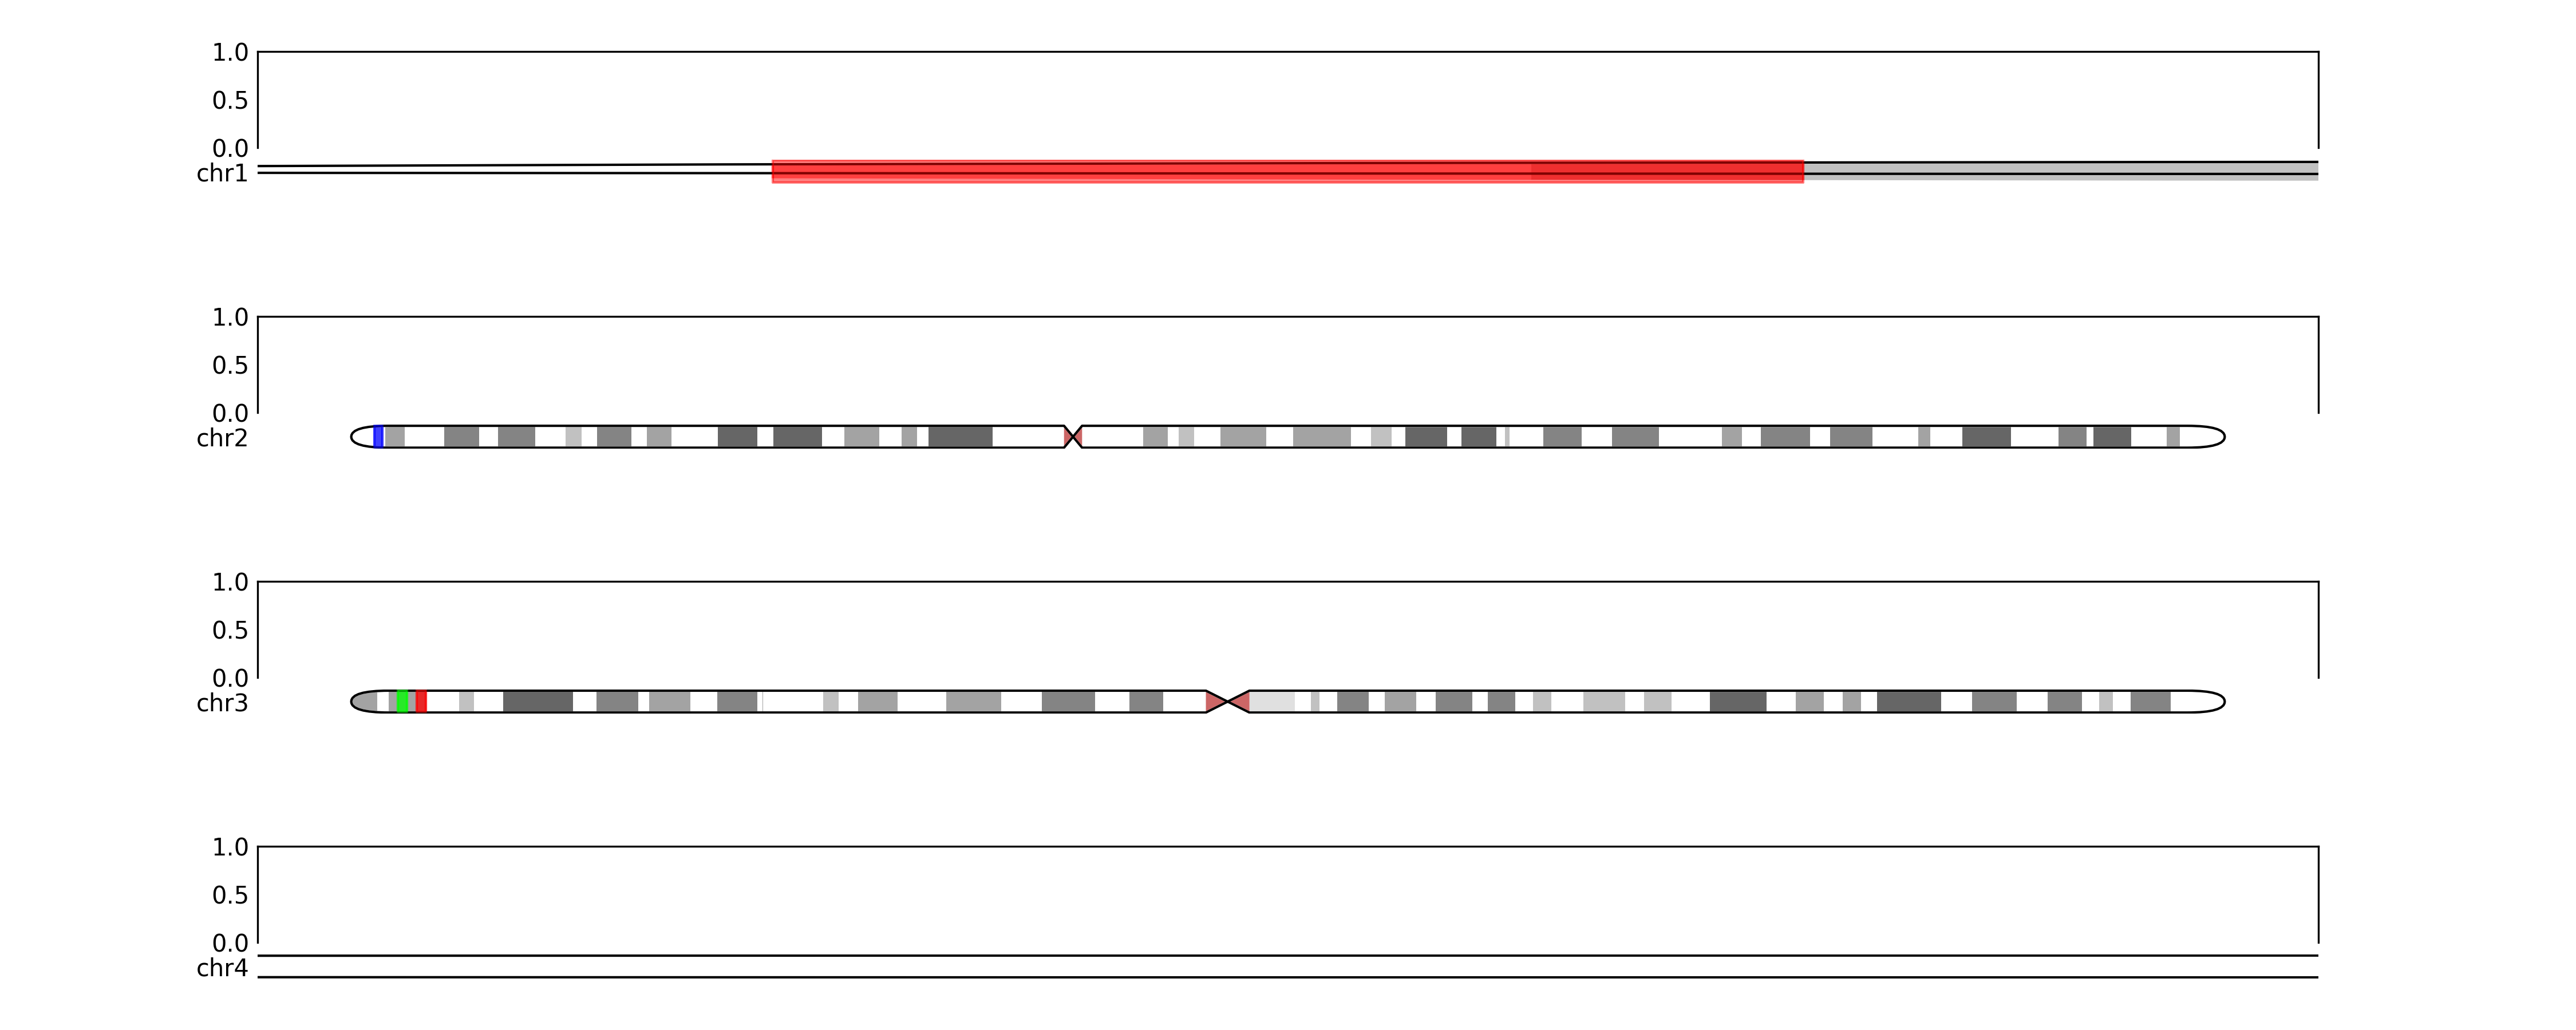
# maybe we want to zoom in on specific regions
zoom_regions = {'chr1': (500000, 2500000), 'chr4': (3000000, 4000000)}
    for chr in zoom_regions:
        zoom(ideogram_axes[chr], start=zoom_regions[chr][0], stop=zoom_regions[chr][1])
fig.savefig(OUT_DIR / "ideogram_grid4.png", dpi=300)
Will output:
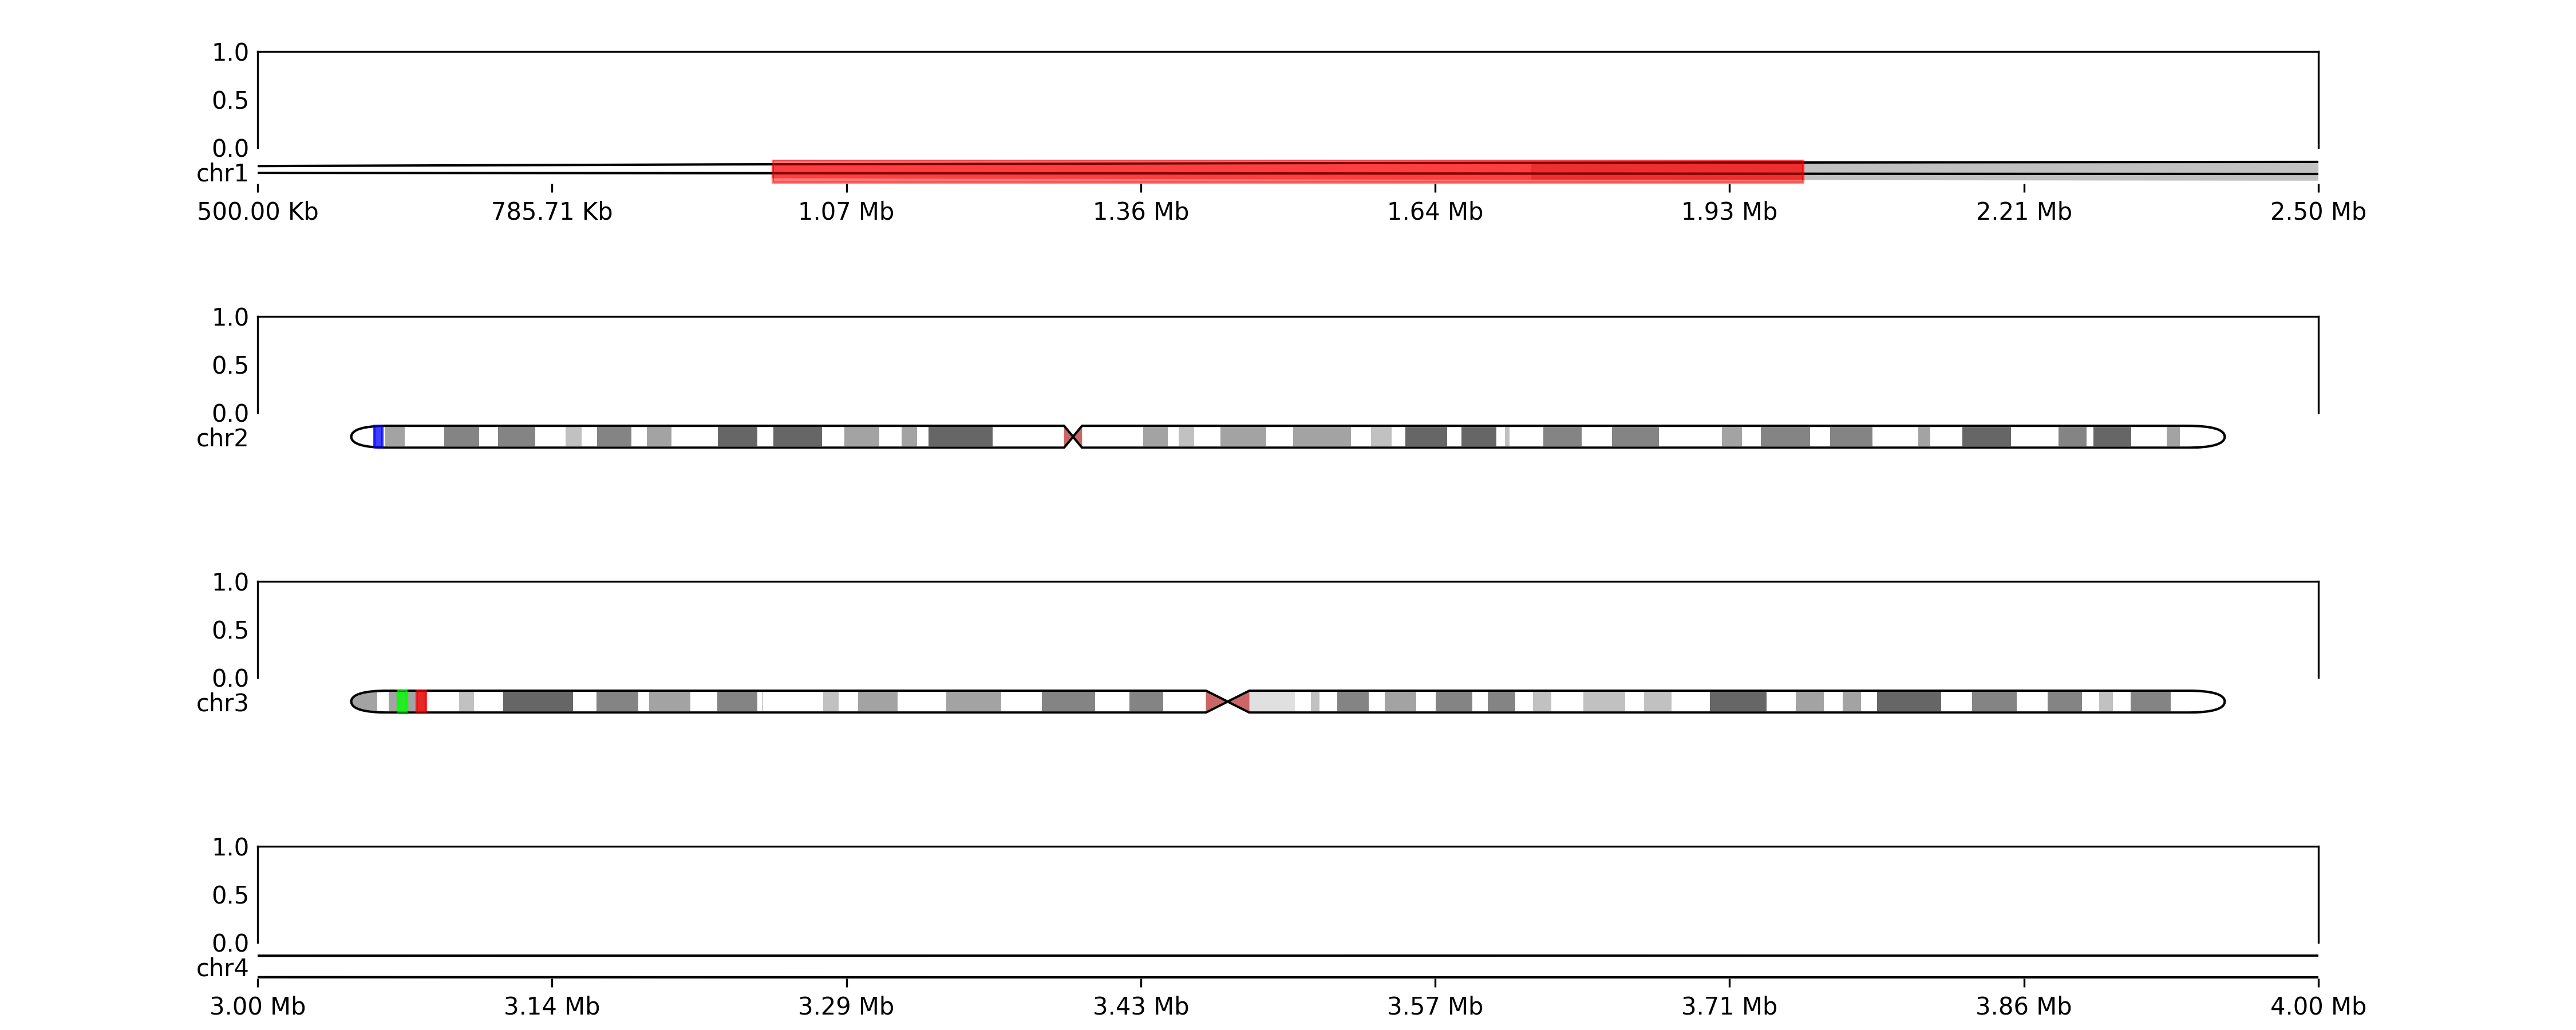
# or we want to show coordinates
for chr in zoom_regions:
    add_ideogram_coordinates(ideogram_axes[chr])
    reset_coordinates(ax[chr], ideogram_axes[chr])
fig.savefig(TEST_DIR / "ideogram_grid5.png", dpi=300)
Will output:
- Investigate the creation of circos plots, by polar transformation.
- Provide more detailed documentation, as some features are not described
karyopyploter is distributed under the terms of the BSD-3-Clause license. Feel free to use in both academic and commercial applications, and please consider to cite the software in your work.
- HG38
- HG19
- CHM13