
Animetrics is a comprehensive project designed for Anime enthusiasts and data aficionados. It involves the extraction of data from "My Anime List" (MAL), one of the most renowned repositories of anime information, to collect and analyze the top 1000 anime of all time. The project is divided into three pivotal phases: Web Scraping, Data Cleaning and analysis, and the development of a Streamlit-powered front-end website to visualize and showcase the findings.
In this phase, web scraping techniques were utilized to extract essential data from "My Anime List".
My Anime List (MAL) stands as one of the most extensive and well-established online databases for anime and manga. With a user-friendly interface, MAL allows us to track, rate, and review anime titles, fostering a vibrant community where users can engage in discussions, create personalized lists of watched shows, and discover new series.
The focus is on obtaining information on the top 1000 anime of all time (according to MAL). The data gathered includes but is not limited to titles, ratings, genres, release dates, popularity, and other relevant metadata.
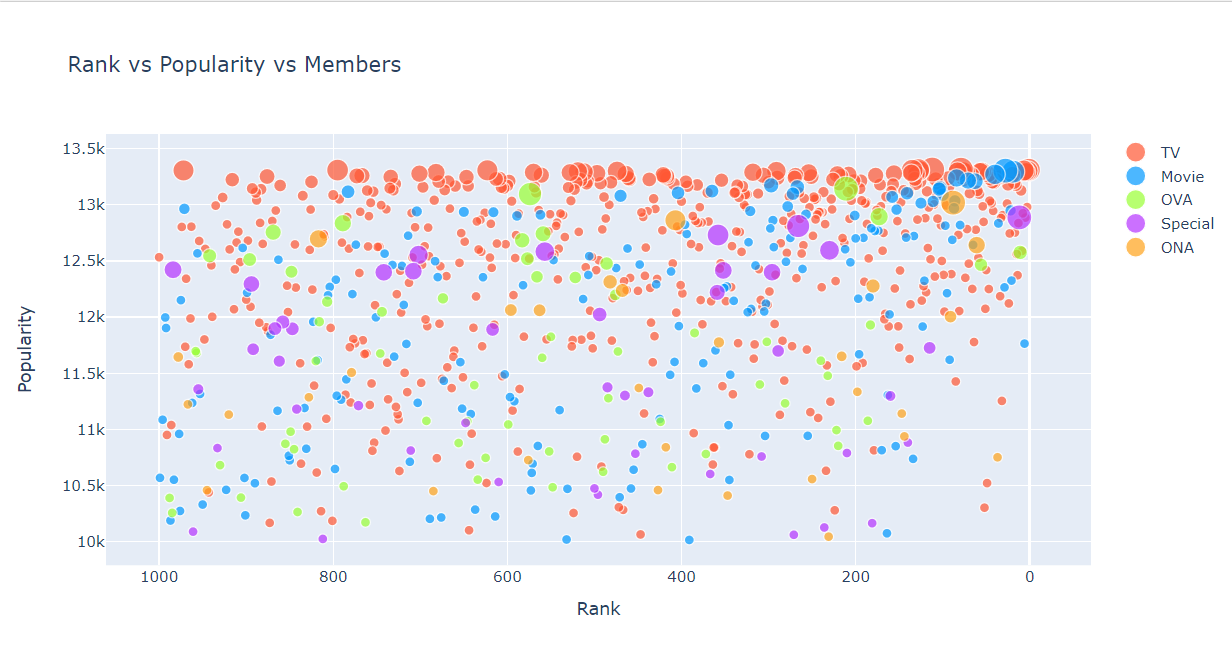
Once the data is gathered, the subsequent phase involves meticulous data cleaning and analysis. The objective here is to ensure data accuracy and to derive insights through various statistical and visual means. This includes data manipulation, and handling missing values, and outliers. The analysis involves plotting diverse charts, such as bar graphs, pie charts, scatter plots, and more, to uncover trends and patterns within the anime dataset.
The final phase of the project encompasses the creation of a user-friendly front-end using Streamlit. This website serves as a platform to present the analyzed data through interactive and visually appealing charts. Users can explore the insights derived from the top 1000 anime in an intuitive and informative manner, through different inferable charts.

Access the project at: https://animetrics.streamlit.app/