![]()
SiYuan Plugin「Embed Series」
Draw high-quality vector graphics directly in SiYuan using LaTeX TikZ syntax.
No external dependencies · Full editability · Free to share
This plugin is an upgraded version of the TikZ Widget (siyuan-tikz), and serves as the first plugin in the Embed Series, aiming to provide a more complete and flexible TikZ experience within SiYuan.
The principle of Embed Series plugins: They are designed solely as auxiliary editing tools for SiYuan, embedding all information directly into formats supported by SiYuan and Markdown. This ensures that all content created by the plugin remains fully visible and functional even after being separated from the plugin — or even from SiYuan itself — such as when exporting to Markdown or sharing on third-party platforms.
For users of the original TikZ Widget, this plugin provides a one-click migration feature to help you quickly transition. For detailed steps, please refer to the Usage Guide section below.
TikZ code
\begin{document}
\begin{tikzpicture}[domain=0:4]
\draw[very thin,color=gray] (-0.1,-1.1) grid (3.9,3.9);
\draw[->] (-0.2,0) -- (4.2,0) node[right] {$x$};
\draw[->] (0,-1.2) -- (0,4.2) node[above] {$f(x)$};
\draw[color=red]    plot (\x,\x)             node[right] {$f(x) =x$};
\draw[color=blue]   plot (\x,{sin(\x r)})    node[right] {$f(x) = \sin x$};
\draw[color=orange] plot (\x,{0.05*exp(\x)}) node[right] {$f(x) = \frac{1}{20} \mathrm e^x$};
\end{tikzpicture}
\end{document}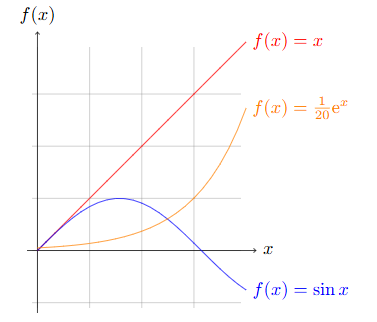
TikZ code
\usepackage{pgfplots}
\usepackage{tikz-3dplot}
\usetikzlibrary{patterns}
\usetikzlibrary{3d,calc}
\usetikzlibrary{arrows.meta}
\begin{document}
\tdplotsetmaincoords{85}{95}
\begin{tikzpicture}[scale=3,line width=0.5pt,tdplot_main_coords]

\draw[rounded corners=0.05pt]
(0,0,1)circle (0.2pt)node[right=4pt,above]{$A$}--
(0,1,0)circle (0.15pt)node[right=4pt,below]{$D$}--
(2,0.4,0)[fill=black]circle(0.25pt)node[below]{$C$}--
(0,-1,0)circle (0.2pt)node[left=4pt,below]{$B$}--
(0,0,1)--cycle;
\draw[thin,dash pattern=on 2pt off 2pt]
(0,-1,0)--(0,0.333,0.666)circle (0.2pt)node[right=4pt,above]{$E$}(0,-1,0)--(0,1,0)(0,0,0)circle (0.2pt)node[left=4pt,below]{$O$}--(2,0.4,0)(0,0,1)--(0,0,0);
\draw(0,0.333,0.666)[draw=black]--(2,0.4,0)(2,0.4,0)--(0,0,1);
\end{tikzpicture}

\end{document}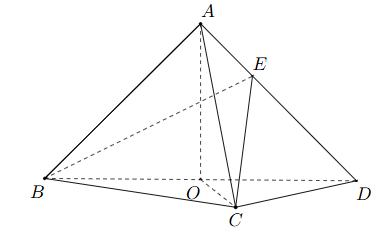
TikZ code
\usepackage{pgfplots}
\usepackage{tikz-3dplot}
\usetikzlibrary{patterns}
\usetikzlibrary{3d,calc}
\usetikzlibrary{arrows.meta}
\begin{document}
\tdplotsetmaincoords{70}{110}
\begin{tikzpicture}[yscale=2,xscale=2,line width=0.5pt,tdplot_main_coords]

\coordinate (A) at (2,0,0);
\coordinate (B) at (2,2,0);
\coordinate (C) at (0,2,0);
\coordinate (D) at (0,0,0);
\coordinate (P) at (0,0,2);
\coordinate (M) at (1,2,0);

\draw[rounded corners=0.05pt](A)circle (0.25pt)node[left=-2pt]{$A$}--
(B)circle (0.25pt)node[below=-2pt]{$B$}--
(C)circle (0.25pt)node[right=-1pt]{$C$}--
(P)circle (0.25pt)node[above=1pt]{$P$}--(A)(P)--(B)(P)--(M)circle (0.25pt)node[right=1pt]{$M$};

\draw[thin,dash pattern=on 2pt off 2pt](A)--(M)
(D)circle (0.25pt)node[left=-2pt]{$D$}--(P)(D)--(C)(D)--(A);
\end{tikzpicture}
\end{document}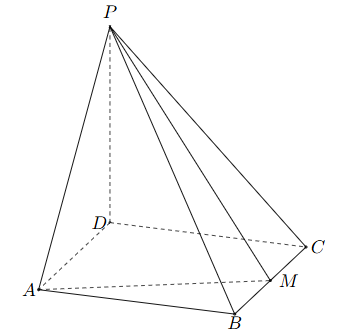
TikZ code
\usepackage{circuitikz}
\begin{document}

\begin{circuitikz}[american, voltage shift=0.5]
\draw (0,0)
to[isource, l=$I_0$, v=$V_0$] (0,3)
to[short, -*, i=$I_0$] (2,3)
to[R=$R_1$, i>_=$i_1$] (2,0) -- (0,0);
\draw (2,3) -- (4,3)
to[R=$R_2$, i>_=$i_2$]
(4,0) to[short, -*] (2,0);
\end{circuitikz}

\end{document}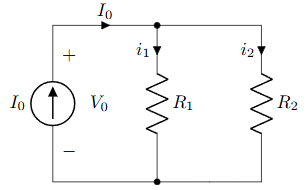
TikZ code
\usepackage{pgfplots}
\pgfplotsset{compat=1.16}

\begin{document}

\begin{tikzpicture}
\begin{axis}[colormap/viridis]
\addplot3[
	surf,
	samples=18,
	domain=-3:3
]
{exp(-x^2-y^2)*x};
\end{axis}
\end{tikzpicture}

\end{document}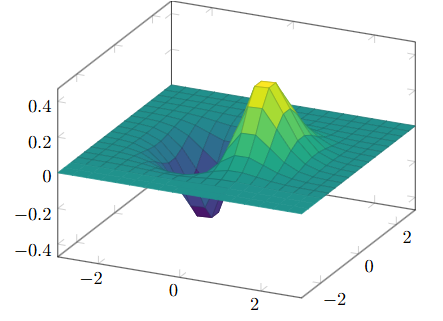
TikZ code
\usepackage{tikz-cd}

\begin{document}

\begin{tikzcd}[row sep=2.5em]

A' \arrow[rr,"f'"] \arrow[dr,swap,"a"] \arrow[dd,swap,"g'"] &&
  B' \arrow[dd,swap,"h'" near start] \arrow[dr,"b"] \\
& A \arrow[rr,crossing over,"f" near start] &&
  B \arrow[dd,"h"] \\
C' \arrow[rr,"k'" near end] \arrow[dr,swap,"c"] && D' \arrow[dr,swap,"d"] \\
& C \arrow[rr,"k"] \arrow[uu,<-,crossing over,"g" near end]&& D

\end{tikzcd}

\end{document}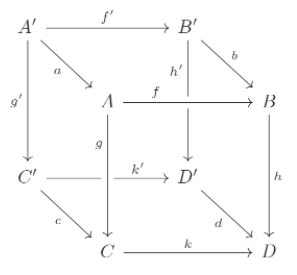
TikZ code
\usepackage{chemfig}
\begin{document}

\chemfig{[:-90]HN(-[::-45](-[::-45]R)=[::+45]O)>[::+45]*4(-(=O)-N*5(-(<:(=[::-60]O)-[::+60]OH)-(<[::+0])(<:[::-108])-S>)--)}

\end{document}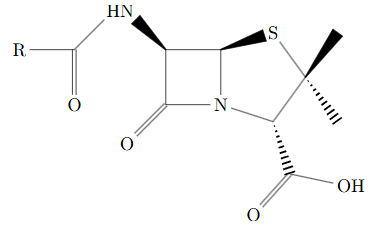
TikZ code
\usepackage{chemfig}
\begin{document}

\definesubmol\fragment1{

    (-[:#1,0.85,,,draw=none]
    -[::126]-[::-54](=_#(2pt,2pt)[::180])
    -[::-70](-[::-56.2,1.07]=^#(2pt,2pt)[::180,1.07])
    -[::110,0.6](-[::-148,0.60](=^[::180,0.35])-[::-18,1.1])
    -[::50,1.1](-[::18,0.60]=_[::180,0.35])
    -[::50,0.6]
    -[::110])
    }

\chemfig{
!\fragment{18}
!\fragment{90}
!\fragment{162}
!\fragment{234}
!\fragment{306}
}

\end{document}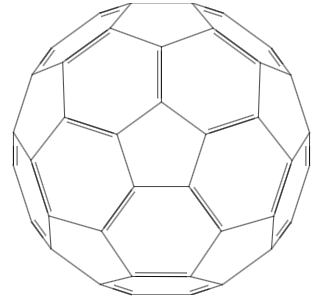
TikZ code
\usepackage{amsmath, amsfonts,times}
\usetikzlibrary{arrows.meta}
\begin{document}
\begin{tikzpicture}
\definecolor{emb_color}{RGB}{252,224,225}
\definecolor{multi_head_attention_color}{RGB}{252,226,187}
\definecolor{add_norm_color}{RGB}{242,243,193}
\definecolor{ff_color}{RGB}{194,232,247}
\definecolor{softmax_color}{RGB}{203,231,207}
\definecolor{linear_color}{RGB}{220,223,240}
\definecolor{gray_bbox_color}{RGB}{243,243,244}
\draw[fill=gray_bbox_color, line width=0.046875cm, rounded corners=0.300000cm] (-0.975000, 6.455000) -- (2.725000, 6.455000) -- (2.725000, 1.305000) -- (-0.975000, 1.305000) -- cycle;
\draw[fill=gray_bbox_color, line width=0.046875cm, rounded corners=0.300000cm] (3.775000, 9.405000) -- (7.475000, 9.405000) -- (7.475000, 1.305000) -- (3.775000, 1.305000) -- cycle;
\draw[line width=0.046875cm, fill=emb_color, rounded corners=0.100000cm] (0.000000, 0.000000) -- (2.500000, 0.000000) -- (2.500000, -0.900000) -- (0.000000, -0.900000) -- cycle;
\node[text width=2.500000cm, align=center] at (1.250000,-0.450000) {Input \vspace{-0.05cm} \linebreak Embedding};
\draw[line width=0.046875cm, fill=emb_color, rounded corners=0.100000cm] (4.000000, 0.000000) -- (6.500000, 0.000000) -- (6.500000, -0.900000) -- (4.000000, -0.900000) -- cycle;
\node[text width=2.500000cm, align=center] at (5.250000,-0.450000) {Output \vspace{-0.05cm} \linebreak Embedding};
\draw[line width=0.046875cm, fill=add_norm_color, rounded corners=0.100000cm] (0.000000, 3.680000) -- (2.500000, 3.680000) -- (2.500000, 3.180000) -- (0.000000, 3.180000) -- cycle;
\node[text width=2.500000cm, align=center] at (1.250000,3.430000) {Add \& Norm};
\draw[line width=0.046875cm, fill=multi_head_attention_color, rounded corners=0.100000cm] (0.000000, 3.030000) -- (2.500000, 3.030000) -- (2.500000, 2.130000) -- (0.000000, 2.130000) -- cycle;
\node[text width=2.500000cm, align=center] at (1.250000,2.580000) {Multi-Head \vspace{-0.05cm} \linebreak Attention};
\draw[line width=0.046875cm] (1.250000, 3.030000) -- (1.250000, 3.180000);
\draw[line width=0.046875cm, fill=add_norm_color, rounded corners=0.100000cm] (4.000000, 6.630000) -- (6.500000, 6.630000) -- (6.500000, 6.130000) -- (4.000000, 6.130000) -- cycle;
\node[text width=2.500000cm, align=center] at (5.250000,6.380000) {Add \& Norm};
\draw[line width=0.046875cm, fill=multi_head_attention_color, rounded corners=0.100000cm] (4.000000, 5.980000) -- (6.500000, 5.980000) -- (6.500000, 5.080000) -- (4.000000, 5.080000) -- cycle;
\node[text width=2.500000cm, align=center] at (5.250000,5.530000) {Multi-Head \vspace{-0.05cm} \linebreak Attention};
\draw[line width=0.046875cm] (5.250000, 5.980000) -- (5.250000, 6.130000);
\draw[line width=0.046875cm, fill=add_norm_color, rounded corners=0.100000cm] (4.000000, 4.080000) -- (6.500000, 4.080000) -- (6.500000, 3.580000) -- (4.000000, 3.580000) -- cycle;
\node[text width=2.500000cm, align=center] at (5.250000,3.830000) {Add \& Norm};
\draw[line width=0.046875cm, fill=multi_head_attention_color, rounded corners=0.100000cm] (4.000000, 3.430000) -- (6.500000, 3.430000) -- (6.500000, 2.130000) -- (4.000000, 2.130000) -- cycle;
\node[text width=2.500000cm, align=center] at (5.250000,2.780000) {Masked \vspace{-0.05cm} \linebreak Multi-Head \vspace{-0.05cm} \linebreak Attention};
\draw[line width=0.046875cm] (5.250000, 3.430000) -- (5.250000, 3.580000);
\draw[line width=0.046875cm, fill=add_norm_color, rounded corners=0.100000cm] (0.000000, 6.230000) -- (2.500000, 6.230000) -- (2.500000, 5.730000) -- (0.000000, 5.730000) -- cycle;
\node[text width=2.500000cm, align=center] at (1.250000,5.980000) {Add \& Norm};
\draw[line width=0.046875cm, fill=ff_color, rounded corners=0.100000cm] (0.000000, 5.580000) -- (2.500000, 5.580000) -- (2.500000, 4.680000) -- (0.000000, 4.680000) -- cycle;
\node[text width=2.500000cm, align=center] at (1.250000,5.130000) {Feed \vspace{-0.05cm} \linebreak Forward};
\draw[line width=0.046875cm] (1.250000, 5.580000) -- (1.250000, 5.730000);
\draw[line width=0.046875cm, fill=add_norm_color, rounded corners=0.100000cm] (4.000000, 9.180000) -- (6.500000, 9.180000) -- (6.500000, 8.680000) -- (4.000000, 8.680000) -- cycle;
\node[text width=2.500000cm, align=center] at (5.250000,8.930000) {Add \& Norm};
\draw[line width=0.046875cm, fill=ff_color, rounded corners=0.100000cm] (4.000000, 8.530000) -- (6.500000, 8.530000) -- (6.500000, 7.630000) -- (4.000000, 7.630000) -- cycle;
\node[text width=2.500000cm, align=center] at (5.250000,8.080000) {Feed \vspace{-0.05cm} \linebreak Forward};
\draw[line width=0.046875cm] (5.250000, 8.530000) -- (5.250000, 8.680000);
\draw[line width=0.046875cm, fill=linear_color, rounded corners=0.100000cm] (4.000000, 10.280000) -- (6.500000, 10.280000) -- (6.500000, 9.780000) -- (4.000000, 9.780000) -- cycle;
\node[text width=2.500000cm, align=center] at (5.250000,10.030000) {Linear};
\draw[line width=0.046875cm, fill=softmax_color, rounded corners=0.100000cm] (4.000000, 11.380000) -- (6.500000, 11.380000) -- (6.500000, 10.880000) -- (4.000000, 10.880000) -- cycle;
\node[text width=2.500000cm, align=center] at (5.250000,11.130000) {Softmax};
\draw[line width=0.046875cm] (1.250000, 0.600000) circle (0.200000);
\draw[line width=0.046875cm] (1.410000, 0.600000) -- (1.090000, 0.600000);
\draw[line width=0.046875cm] (1.250000, 0.760000) -- (1.250000, 0.440000);
\draw[line width=0.046875cm] (5.250000, 0.600000) circle (0.200000);
\draw[line width=0.046875cm] (5.410000, 0.600000) -- (5.090000, 0.600000);
\draw[line width=0.046875cm] (5.250000, 0.760000) -- (5.250000, 0.440000);
\draw[line width=0.046875cm] (0.350000, 0.600000) circle (0.400000);
\draw[line width=0.046875cm] (-0.030000, 0.600000) -- (-0.014490, 0.629156) -- (0.001020, 0.657833) -- (0.016531, 0.685561) -- (0.032041, 0.711884) -- (0.047551, 0.736369) -- (0.063061, 0.758616) -- (0.078571, 0.778258) -- (0.094082, 0.794973) -- (0.109592, 0.808486) -- (0.125102, 0.818576) -- (0.140612, 0.825077) -- (0.156122, 0.827883) -- (0.171633, 0.826946) -- (0.187143, 0.822284) -- (0.202653, 0.813971) -- (0.218163, 0.802145) -- (0.233673, 0.786999) -- (0.249184, 0.768783) -- (0.264694, 0.747796) -- (0.280204, 0.724382) -- (0.295714, 0.698925) -- (0.311224, 0.671845) -- (0.326735, 0.643584) -- (0.342245, 0.614608) -- (0.357755, 0.585392) -- (0.373265, 0.556416) -- (0.388776, 0.528155) -- (0.404286, 0.501075) -- (0.419796, 0.475618) -- (0.435306, 0.452204) -- (0.450816, 0.431217) -- (0.466327, 0.413001) -- (0.481837, 0.397855) -- (0.497347, 0.386029) -- (0.512857, 0.377716) -- (0.528367, 0.373054) -- (0.543878, 0.372117) -- (0.559388, 0.374923) -- (0.574898, 0.381424) -- (0.590408, 0.391514) -- (0.605918, 0.405027) -- (0.621429, 0.421742) -- (0.636939, 0.441384) -- (0.652449, 0.463631) -- (0.667959, 0.488116) -- (0.683469, 0.514439) -- (0.698980, 0.542167) -- (0.714490, 0.570844) -- (0.730000, 0.600000);
\draw[line width=0.046875cm] (6.150000, 0.600000) circle (0.400000);
\draw[line width=0.046875cm] (5.770000, 0.600000) -- (5.785510, 0.629156) -- (5.801020, 0.657833) -- (5.816531, 0.685561) -- (5.832041, 0.711884) -- (5.847551, 0.736369) -- (5.863061, 0.758616) -- (5.878571, 0.778258) -- (5.894082, 0.794973) -- (5.909592, 0.808486) -- (5.925102, 0.818576) -- (5.940612, 0.825077) -- (5.956122, 0.827883) -- (5.971633, 0.826946) -- (5.987143, 0.822284) -- (6.002653, 0.813971) -- (6.018163, 0.802145) -- (6.033673, 0.786999) -- (6.049184, 0.768783) -- (6.064694, 0.747796) -- (6.080204, 0.724382) -- (6.095714, 0.698925) -- (6.111224, 0.671845) -- (6.126735, 0.643584) -- (6.142245, 0.614608) -- (6.157755, 0.585392) -- (6.173265, 0.556416) -- (6.188776, 0.528155) -- (6.204286, 0.501075) -- (6.219796, 0.475618) -- (6.235306, 0.452204) -- (6.250816, 0.431217) -- (6.266327, 0.413001) -- (6.281837, 0.397855) -- (6.297347, 0.386029) -- (6.312857, 0.377716) -- (6.328367, 0.373054) -- (6.343878, 0.372117) -- (6.359388, 0.374923) -- (6.374898, 0.381424) -- (6.390408, 0.391514) -- (6.405918, 0.405027) -- (6.421429, 0.421742) -- (6.436939, 0.441384) -- (6.452449, 0.463631) -- (6.467959, 0.488116) -- (6.483469, 0.514439) -- (6.498980, 0.542167) -- (6.514490, 0.570844) -- (6.530000, 0.600000);
\draw[line width=0.046875cm, -latex] (1.250000, 3.680000) -- (1.250000, 4.680000);
\draw[line width=0.046875cm, -latex] (5.250000, 6.630000) -- (5.250000, 7.630000);
\draw[line width=0.046875cm, -latex] (5.250000, 9.180000) -- (5.250000, 9.780000);
\draw[line width=0.046875cm, -latex] (5.250000, 10.280000) -- (5.250000, 10.880000);
\draw[line width=0.046875cm, -latex] (1.250000, 0.000000) -- (1.250000, 0.400000);
\draw[line width=0.046875cm, -latex] (1.250000, 0.800000) -- (1.250000, 2.130000);
\draw[line width=0.046875cm, -latex] (5.250000, 0.800000) -- (5.250000, 2.130000);
\draw[line width=0.046875cm, -latex] (5.250000, 0.000000) -- (5.250000, 0.400000);
\draw[line width=0.046875cm] (0.750000, 0.600000) -- (1.050000, 0.600000);
\draw[line width=0.046875cm] (5.450000, 0.600000) -- (5.750000, 0.600000);
\draw[-latex, line width=0.046875cm, rounded corners=0.200000cm] (1.250000, 4.080000) -- (-0.750000, 4.080000) -- (-0.750000, 5.980000) -- (0.000000, 5.980000);
\draw[-latex, line width=0.046875cm, rounded corners=0.200000cm] (1.250000, 1.530000) -- (-0.750000, 1.530000) -- (-0.750000, 3.430000) -- (0.000000, 3.430000);
\draw[-latex, line width=0.046875cm, rounded corners=0.200000cm] (5.250000, 1.530000) -- (7.250000, 1.530000) -- (7.250000, 3.830000) -- (6.500000, 3.830000);
\draw[-latex, line width=0.046875cm, rounded corners=0.200000cm] (5.250000, 4.480000) -- (7.250000, 4.480000) -- (7.250000, 6.380000) -- (6.500000, 6.380000);
\draw[-latex, line width=0.046875cm, rounded corners=0.200000cm] (5.250000, 7.030000) -- (7.250000, 7.030000) -- (7.250000, 8.930000) -- (6.500000, 8.930000);
\draw[-latex, line width=0.046875cm, rounded corners=0.200000cm] (1.250000, 1.730000) -- (0.312500, 1.730000) -- (0.312500, 2.130000);
\draw[-latex, line width=0.046875cm, rounded corners=0.200000cm] (1.250000, 1.730000) -- (2.187500, 1.730000) -- (2.187500, 2.130000);
\draw[-latex, line width=0.046875cm, rounded corners=0.200000cm] (5.250000, 1.730000) -- (4.312500, 1.730000) -- (4.312500, 2.130000);
\draw[-latex, line width=0.046875cm, rounded corners=0.200000cm] (5.250000, 1.730000) -- (6.187500, 1.730000) -- (6.187500, 2.130000);
\draw[-latex, line width=0.046875cm, rounded corners=0.200000cm] (1.250000, 6.230000) -- (1.250000, 7.230000) -- (3.250000, 7.230000) -- (3.250000, 4.680000) -- (4.312500, 4.680000) -- (4.312500, 5.080000);
\draw[-latex, line width=0.046875cm, rounded corners=0.200000cm] (1.250000, 6.230000) -- (1.250000, 7.230000) -- (3.250000, 7.230000) -- (3.250000, 4.680000) -- (5.250000, 4.680000) -- (5.250000, 5.080000);
\draw[-latex, line width=0.046875cm, rounded corners=0.200000cm] (5.250000, 4.080000) -- (5.250000, 4.680000) -- (6.187500, 4.680000) -- (6.187500, 5.080000);
\draw[line width=0.046875cm, -latex] (1.250000, -1.500000) -- (1.250000, -0.900000);
\draw[line width=0.046875cm, -latex] (5.250000, -1.500000) -- (5.250000, -0.900000);
\draw[line width=0.046875cm, -latex] (5.250000, 11.380000) -- (5.250000, 11.980000);
\node[text width=2.500000cm, anchor=north, align=center] at (1.250000,-1.500000) {Inputs};
\node[text width=2.500000cm, anchor=north, align=center] at (5.250000,-1.500000) {Outputs \vspace{-0.05cm} \linebreak (shifted right)};
\node[text width=2.500000cm, anchor=south, align=center] at (5.250000,11.980000) {Output \vspace{-0.05cm} \linebreak Probabilities};
\node[anchor=east] at (-1.175000,3.880000) {$N\times$};
\node[anchor=west] at (7.675000,5.355000) {$N\times$};
\node[text width=2.000000cm, anchor=east] at (0.250000,0.600000) {Positional \vspace{-0.05cm} \linebreak Encoding};
\node[text width=2.000000cm, anchor=west] at (6.750000,0.600000) {Positional \vspace{-0.05cm} \linebreak Encoding};
\end{tikzpicture}
\end{document}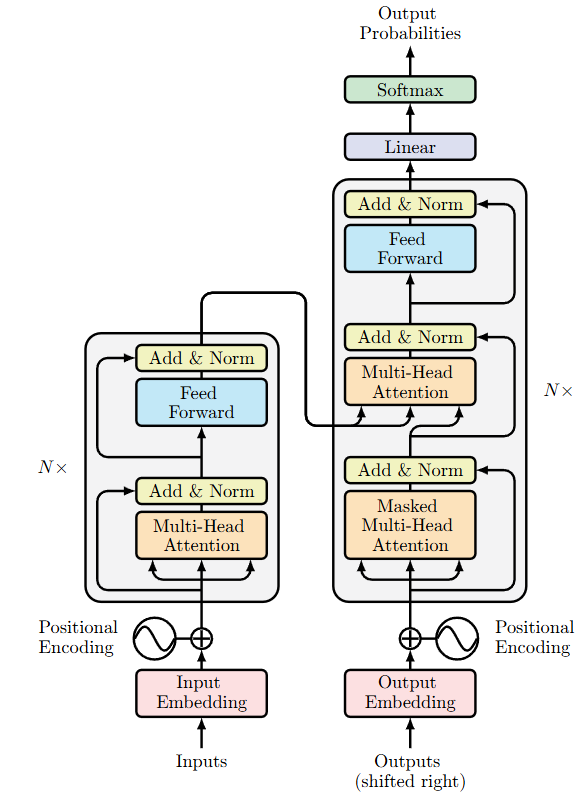
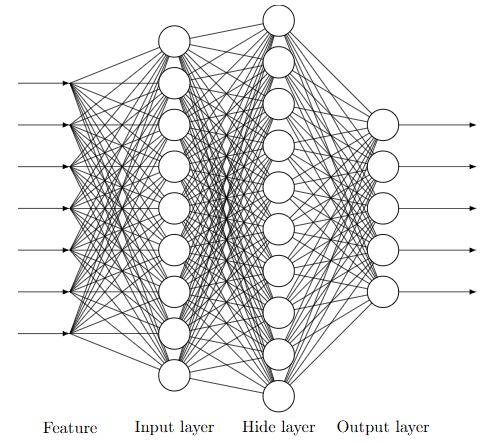
TikZ code
\usepackage{tikz}
\usetikzlibrary{fpu}
\usetikzlibrary{math}
\begin{document}
\begin{tikzpicture}
    \tikzmath{
        function paint_nodes(\radius,\gapy,\posx,\num){
            \gapy = \gapy+\radius*2;
            \starty = \gapy*(\num-1)/2;
            for \i in {0,...,\num-1}{
                \drawy = \starty - \i*\gapy;
                {
                    \filldraw[line width = 0.5pt,fill = white] (\posx,\drawy) circle (\radius);
                };
            };
        };
        function paint_lines(\radius,\gapy,\posx,\num,\nextposx,\nextnum){
            \gapy = \gapy+\radius*2;
            \starty = \gapy*(\num-1)/2;
            \startyy = \gapy*(\nextnum-1)/2;
            for \i in {0,...,\num-1}{
                \drawy = \starty - \i*\gapy;
                for \j in {0,...,\nextnum-1}{
                    \drawyy = \startyy - \j*\gapy;
                    {
                        \draw (\posx,\drawy) -- (\nextposx,\drawyy);
                    };
                };
            };
        };
        function paint_x_lines(\radius,\gapy,\posx,\num,\ifright,\len){
            \gapy = \gapy+\radius*2;
            \starty = \gapy*(\num-1)/2;
            for \i in {0,...,\num-1}{
                \drawy = \starty - \i*\gapy;
                if \ifright == 1 then{
                    {
                        \draw[-latex] (\posx,\drawy) -- (\posx+\len,\drawy);
                    };
                }else{
                    {
                        \draw[-latex] (\posx,\drawy)--(\posx-\len,\drawy);
                    };
                };
            };
        };
        function paint_net(\x0,\x1,\x2,\x3){
            \gapx = 2;
            \radius = 0.3;
            \gapy = 0.2;
            paint_lines(\radius,\gapy,0*\gapx,\x0,1*\gapx,\x1);
            paint_lines(\radius,\gapy,1*\gapx,\x1,2*\gapx,\x2);
            paint_lines(\radius,\gapy,2*\gapx,\x2,3*\gapx,\x3);
            paint_x_lines(\radius,\gapy,3*\gapx,\x3,1,1.8);
            paint_x_lines(\radius,\gapy,0*\gapx-1,\x0,1,1);
            paint_nodes(\radius,\gapy,1*\gapx,\x1);
            paint_nodes(\radius,\gapy,2*\gapx,\x2);
            paint_nodes(\radius,\gapy,3*\gapx,\x3);
        };
        paint_net(7,9,10,5);
    }
    \node[scale = 0.9] at (0,-4.2) {Feature};
    \node[scale = 0.9] at (2,-4.2) {Input layer};
    \node[scale = 0.9] at (4,-4.2) {Hide layer};
    \node[scale = 0.9] at (6,-4.2) {Output layer};

\end{tikzpicture}
\end{document}
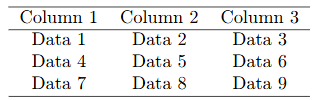
TikZ code
\tikz \node {
  \begin{tabular}{ccc}
  \hline
  Column 1 & Column 2 & Column 3 \\
  \hline
  Data 1 & Data 2 & Data 3 \\
  Data 4 & Data 5 & Data 6 \\
  Data 7 & Data 8 & Data 9 \\
  \hline
  \end{tabular}
};
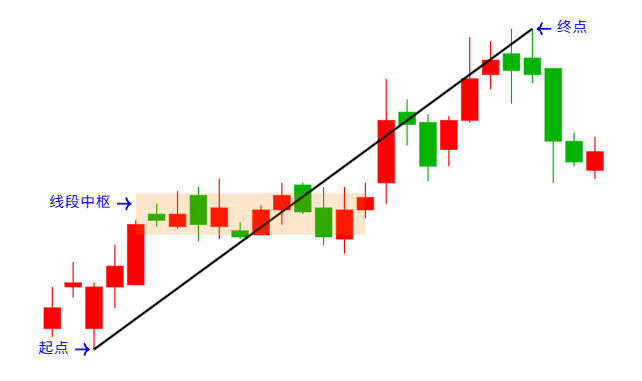
TikZ code
\usetikzlibrary{arrows.meta}

% 定义绘制K线的命令: \candle{横坐标}{开盘价}{收盘价}{最高价}{最低价}
\newcommand{\candle}[5]{
    \edef\xpos{#1}%
    \edef\open{#2}%
    \edef\close{#3}%
    \edef\high{#4}%
    \edef\low{#5}%
    \ifdim#3 pt > #2 pt
        \edef\color{red}
    \else
        \edef\color{green!70!black}
    \fi
    \draw[\color, thick] (\xpos,\low) -- (\xpos,\high);
    \draw[\color, fill=\color] (\xpos-0.4,\open) rectangle (\xpos+0.4,\close);
}

% 定义箭头命令:\arrow{方向}{横坐标}{价格}{文字}{颜色}
\newcommand{\arrow}[5]{%
    \def\dir{#1}%
    \def\x{#2}%
    \def\y{#3}%
    \def\labeltext{#4}%
    \def\arrowcolor{#5}%
    \def\thick{very thick}
    %
    \ifnum\pdfstrcmp{\dir}{down}=0
        \draw[<-, \arrowcolor, \thick] (\x,\y) -- (\x,\y+0.7)
            node[above, text=\arrowcolor] {\labeltext};
    \else\ifnum\pdfstrcmp{\dir}{up}=0
        \draw[<-, \arrowcolor, \thick] (\x,\y) -- (\x,\y-0.7)
            node[below, text=\arrowcolor] {\labeltext};
    \else\ifnum\pdfstrcmp{\dir}{right}=0
        \draw[<-, \arrowcolor, \thick] (\x,\y) -- (\x-0.7,\y)
            node[left, text=\arrowcolor] {\labeltext};
    \else\ifnum\pdfstrcmp{\dir}{left}=0
        \draw[<-, \arrowcolor, \thick] (\x,\y) -- (\x+0.7,\y)
            node[right, text=\arrowcolor] {\labeltext};
    \fi\fi\fi\fi
}

% 定义曲线命令:\curve{颜色}{宽度}{点列表}
\newcommand{\curve}[3]{
    \draw[#1, line width=#2, smooth] plot coordinates {#3};
}
% 定义折线命令:\lines{颜色}{宽度}{点列表}
\newcommand{\lines}[3]{
    \draw[#1, line width=#2] plot coordinates {#3};
}

% 定义半透明矩形命令:\orect{颜色}{不透明度}{左上角坐标}{右下角坐标}
\newcommand{\orect}[4]{
    \fill[#1, fill opacity=#2] #3 rectangle #4;
}

\begin{document}
\begin{tikzpicture}[x=0.5cm, y=0.5cm]
    \candle{1}{4.00}{5.00}{6.00}{3.60}
    \candle{2}{6.00}{6.20}{5.50}{7.20}
    \candle{3}{4.00}{6.00}{6.20}{3.00}
    \candle{4}{6.00}{7.00}{8.00}{5.00}
    \candle{5}{6.10}{9.00}{9.20}{6.10}
    \candle{6}{9.50}{9.20}{10.00}{8.90}
    \candle{7}{8.90}{9.50}{10.60}{8.80}
    \candle{8}{10.40}{9.00}{10.80}{8.20}
    \candle{9}{8.90}{9.80}{11.20}{8.30}
    \candle{10}{8.70}{8.40}{9.10}{8.30}
    \candle{11}{8.50}{9.70}{9.90}{8.50}
    \candle{12}{9.70}{10.40}{11.00}{9.00}
    \candle{13}{10.90}{9.60}{11.00}{9.50}
    \candle{14}{9.80}{8.40}{10.80}{8.00}
    \candle{15}{8.30}{9.70}{10.80}{7.60}
    \candle{16}{9.70}{10.30}{11.00}{9.30}
    \candle{17}{11.00}{14.00}{16.00}{10.00}
    \candle{18}{14.40}{13.80}{15.00}{12.80}
    \candle{19}{13.90}{11.80}{14.30}{11.10}
    \candle{20}{12.60}{14.00}{14.20}{11.80}
    \candle{21}{14.00}{16.00}{18.00}{13.90}
    \candle{22}{16.20}{16.90}{17.80}{15.50}
    \candle{23}{17.20}{16.40}{18.40}{14.80}
    \candle{24}{17.00}{16.20}{18.40}{15.80}
    \candle{25}{16.50}{13.00}{16.50}{11.00}
    \candle{26}{13.00}{12.00}{13.40}{11.80}
    \candle{27}{11.60}{12.50}{13.20}{11.20}

    \lines{black}{1.5pt}{(3,3.00) (24,18.40)}

    \arrow{right}{2.8}{3.00}{起点}{blue}
    \arrow{left}{24.2}{18.40}{终点}{blue}

    \orect{orange}{0.2}{(5,8.50)}{(16,10.50)}
    \arrow{right}{4.8}{10.00}{线段中枢}{blue}
\end{tikzpicture}
\end{document}
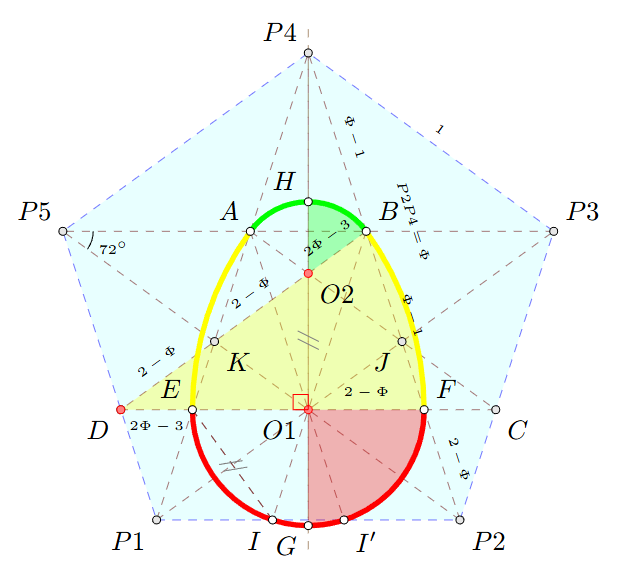
TikZ 代码
\documentclass{standalone}

% 引入tkz-euclide宏包
\usepackage{tkz-euclide}

\begin{document}

% 绘制环境(可以使用任何有效TikZ参数)
\begin{tikzpicture}
  % 定义单位圆半径(长度可任意)
  \edef\r{2cm}
  % 定义基础点(尽可能少)
  \tkzDefPoints{0/-2/M, 0/2/N}
  % 计算其它点
  % 定义垂直平分线并求垂足
  \tkzDefLine[mediator](M,N) \tkzGetPoints{x}{x'}
  \tkzInterLL(M,N)(x,x') \tkzGetPoint{O}
  % 确定正五边形连长
  \tkzInterLC[R](x',x)(O,\r) \tkzGetPoints{b}{a}
  % 定义正五边形,求得五个顶点
  \tkzDefRegPolygon[side,sides=5,name=P](a,b)
  % 求对角线交点
  \tkzInterLL(P1,P4)(P3,P5) \tkzGetPoint{A}
  \tkzInterLL(P2,P4)(P3,P5) \tkzGetPoint{B}
  % 求边线上的交点
  \tkzInterLC[with nodes](P2,P3)(A,P4,P3) \tkzGetPoints{C}{c}
  \tkzInterLC[with nodes](P1,P5)(B,P4,P5) \tkzGetPoints{d}{D}
  % 求各直线交点
  \tkzInterLL(C,D)(M,N) \tkzGetPoint{O1}
  \tkzInterLL(C,D)(P1,P4) \tkzGetPoint{E}
  \tkzInterLL(C,D)(P2,P4) \tkzGetPoint{F}
  \tkzInterLL(B,D)(A,C) \tkzGetPoint{O2}
  \tkzInterLL(P2,P5)(B,D) \tkzGetPoint{K}
  \tkzInterLL(P1,P3)(A,C) \tkzGetPoint{J}
  % 求欧氏蛋与底边交点
  \tkzInterLC(P1,P2)(O1,F) \tkzGetPoints{I}{I'}
  % 求欧氏蛋顶点
  \tkzInterLC(M,N)(O1,F) \tkzGetPoints{G}{g}
  \tkzInterLC(M,N)(O2,A) \tkzGetPoints{h}{H}

  % 绘制
  % 绘制基础正五边形和需要线段
  \tkzDrawPolygon[dashed,fill=cyan!30,draw=blue,fill opacity=0.3](P1,P2,P3,P4,P5)
  \tkzDrawSegments[dashed, red!40!black](P1,P4 P1,P3 P2,P4 P2,P5 P3,P5 P4,O E,I)
  \tkzDrawSegments[dashed, red!40!black](A,C B,D C,D E,I A,I' B,I)

  % 绘制纵轴
  \tkzDrawLine[dashed, add = 0.05 and 0.05, color = orange!40!black](G,P4)

  % 绘制欧氏蛋
  \tkzFillSector[fill=red,fill opacity=0.3](O1,G)(F)
  \tkzDrawArc[line width=2pt,draw=red](O1,G)(F)
  \tkzFillSector[fill=yellow,fill opacity=0.3](D,F)(B)
  \tkzDrawArc[line width=2pt,draw=yellow](D,F)(B)
  \tkzFillSector[fill=green,fill opacity=0.3](O2,B)(H)
  \tkzDrawArc[line width=2pt,draw=green](O2,B)(H)
  \tkzDrawArc[line width=2pt,draw=green](O2,H)(A)
  \tkzDrawArc[line width=2pt,draw=yellow](C,A)(E)
  \tkzDrawArc[line width=2pt,draw=red](O1,E)(G)

  % 绘制点
  \tkzSetUpPoint[size = 3]
  \tkzDrawPoints(P1,P2,P3,P4,P5,C,D,J,K)
  \tkzSetUpPoint[fill = red!50, color = red]
  \tkzDrawPoints(O1,O2,D)
  \tkzSetUpPoint[fill = white, color = black]
  \tkzDrawPoints(H,B,F,G,E,A,I,I')

  % 标记
  % 标记相等线段
  \tkzMarkSegments[color=gray,pos=0.5,mark=s||](E,I O1,O2)
  % 标记角
  \tkzMarkAngle[size=0.4](P2,P5,P3)
  \tkzMarkRightAngle[red,size=0.2](P4,O1,D)

  % 标注各点名称
  \tkzLabelPoints[above left](P4,P5,H,A,E)
  \tkzLabelPoints[above right](B,P3,F)
  \tkzLabelPoints[below left](D,P1,G,O1,J,I)
  \tkzLabelPoints[below right](P2,C,K,O2,I')

  % 标注角度
  \tkzLabelAngle[pos=0.7,font=\tiny](P2,P5,P3){$72^\circ$}

  % 标注线段长度
  \tkzLabelSegment[above,sloped,midway,font=\tiny](P3,P4){$1$}
  \tkzLabelSegment[above,sloped,midway,shift={(-20pt,12pt)},font=\tiny](P2,P4){$P2P4=\Phi$}
  \tkzLabelSegment[above,sloped,midway,font=\tiny](B,P4){$\Phi-1$}
  \tkzLabelSegment[above,sloped,midway,font=\tiny](F,B){$\Phi-1$}
  \tkzLabelSegment[above,sloped,midway,font=\tiny](F,P2){$2-\Phi$}
  \tkzLabelSegment[above,sloped,midway,font=\tiny](F,O1){$2-\Phi$}
  \tkzLabelSegment[above,sloped,midway,font=\tiny](D,K){$2-\Phi$}
  \tkzLabelSegment[above,sloped,midway,font=\tiny](K,O2){$2-\Phi$}
  \tkzLabelSegment[above,sloped,midway,font=\tiny](O2,B){$2\Phi-3$}
  \tkzLabelSegment[below,sloped,midway,font=\tiny](D,E){$2\Phi-3$}
\end{tikzpicture}

\end{document}
- Offline usage (no internet required)
- CodeMirror editor (syntax highlighting, auto-completion, error hints)
- Support for rendering multiple TikZ pictures within a single TikZ code
- Full Chinese character support
If you have additional feature requests or suggestions, feel free to open an issue on GitHub or post in the SiYuan community.
Supported Packages:
- tikz-cd
- tikz-3dplot
- circuitikz
- chemfig
- pgfplots
- array
- tkz-euclide
If your code fails to render properly, it's likely due to an unsupported package. Please open an issue on GitHub or post in the SiYuan community to request support for additional packages.
Create a TikZ Image:
Type /tikz in the editor to create a new TikZ image.
Edit a TikZ Image:
Click the menu button in the top-right corner of the image. If the block is recognized as a valid TikZ image, an Edit TikZ option will appear. Click it to open the editor.
Migrate from TikZ Widget:
Click the menu button on the left side of a TikZ Widget block. An option labeled Convert to Embed TikZ will appear. Click it to convert the old widget block into a new Embed Series image.
- v0.7.4
- Fix: amsfont display
- v0.7.3
- change SiYuan version requirement: >=3.0.0
- v0.7.2
- Fix: amsfont display
- v0.7.1
- Fix: configuration
nodes in empty cellsof tikz-cd conflict with pgfplots
- Fix: configuration
- v0.7.0
- Add Package: tkz-euclide
- v0.6.9
- Fix: image is invisible in viewer
- v0.6.8
- Update plugin name
- v0.6.7
- Improve: package size
- Improve: hint of editor
- v0.6.6
- Improve: dark mode support
- v0.6.5
- Improve: focus on editor when opening edit dialog #1
- v0.6.4
- Fix bug: Error hint when inputing empty TikZ code
- v0.6.3
- Fix bug: Keyboard shortcuts in the CodeMirror editor are being passed through to the SiYuan editor #1
- v0.6.2
- Optimize migration from the original TikZ Widget
- Optimize SVG display in dark mode
- v0.6.1
- Optimize English support
- v0.6.0
- Inherits all core features from the original TikZ Widget (
siyuan-tikz) - Added ability to edit TikZ image via the top-right menu button
- One-click migration from the original TikZ Widget
- TikZ code and fonts are now embedded directly into the image (SVG metadata)
- Inherits all core features from the original TikZ Widget (