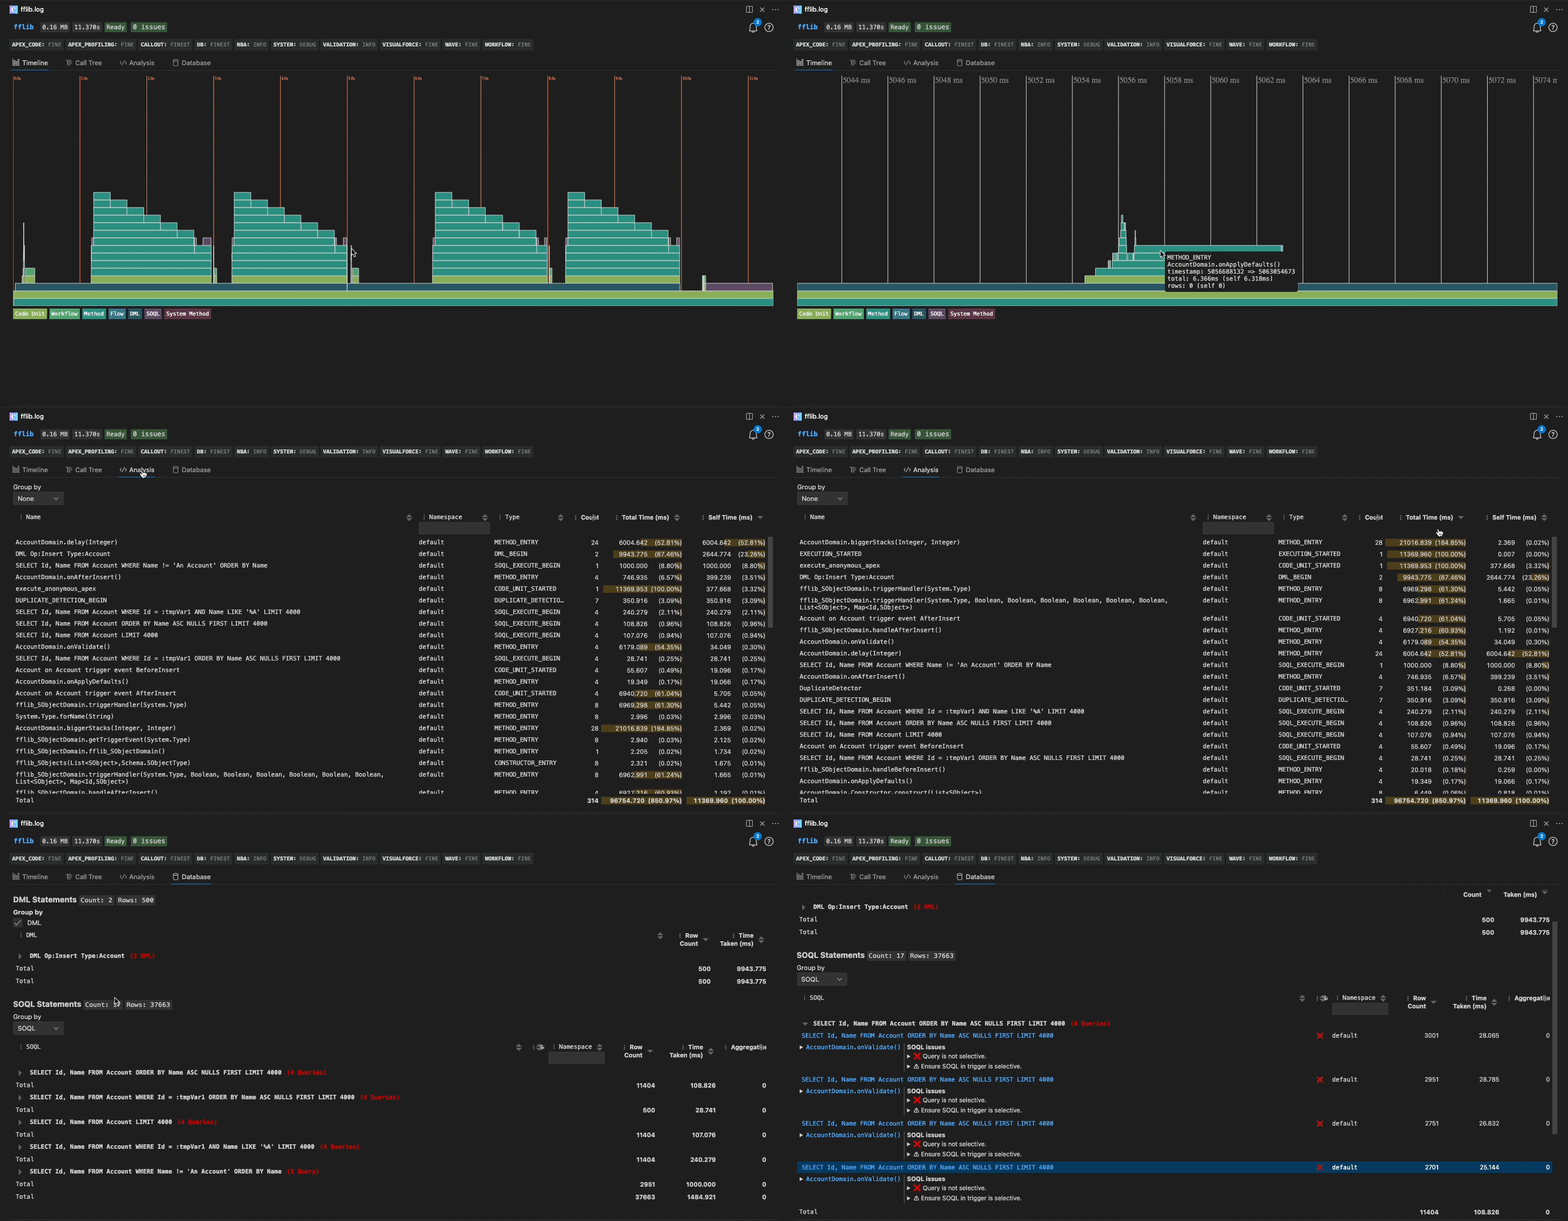
Apex Log Analyzer makes performance analysis of Salesforce debug logs much easier and quicker. Visualize code execution via a Flame chart and Call Tree, identify and resolve performance and SOQL/DML problems via Method and Database Analysis.
In general set the
APEX_CODEdebug flag to beFINEor higher, with a lower level the log will likely not contain enough detail for meaningful analysis.The quality of data shown depends entirely on the data contained in the log files.
Special care should be taken when looking at log files that have been truncated as you are only seeing a part of the execution and that may lead you to misunderstand what is really happening.A log level of
FINEseems to give a good balance between log detail and execution time.
Higher log levels result in higher reported execution time than would be seen with logging off.
This is due to the over head associated with logging method entry and exit.
Getting Started | Features | Settings | Explore the Docs | Contributing | Contributors | License
Search for Apex Log Analyzer from the extensions side bar in VS Code and click Install or
install from the VS Code market place by clicking install on Visual Studio Code Market Place: Apex Log Analyzer
Click Switch to Pre-Release Version on the banner to get bleeding edge changes and help us to resolve bugs before the stable release.
Open command pallette (CMD/CTRL + Shift + P), paste ext install financialforce.lana, and press enter.
ext install financialforce.lanaStart the analysis either from a log you have already downloaded or by downloading a log from an org. On larger logs the analysis window make take a few seconds to appear.
With the .log file open in VSCode.
- Open command pallette (CMD/CTRL + Shift + P) -> 'Log: Show Apex Log Analysis'
or - Click the 'Log: Show Apex Log Analysis' code lens at the top of the file

or - Right click -> 'Log: Show Apex Log Analysis' or
- Click editor 'Log: Show Apex Log Analysis' icon button at top of editor or
- Right click editor tab -> 'Log: Show Apex Log Analysis'
- Open command pallette (CMD/CTRL + Shift + P) -> 'Log: Retrieve Apex Log And Show Analysis
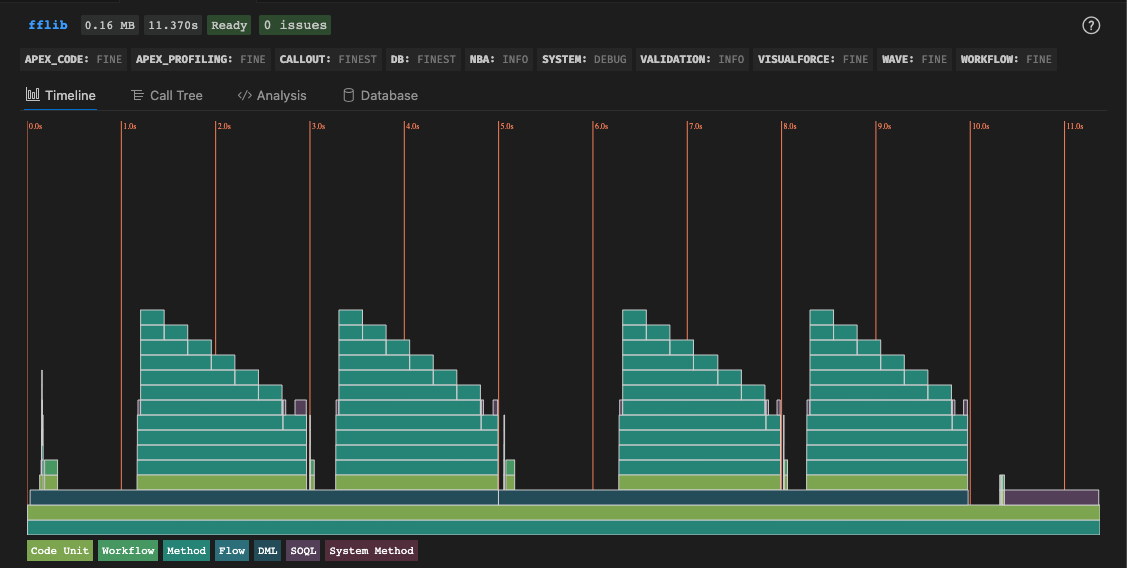
- 🔥 Timeline / Flame chart - Gain a deep understanding of code execution over time via a timeline flame chart and tooltips to show additional information about events.
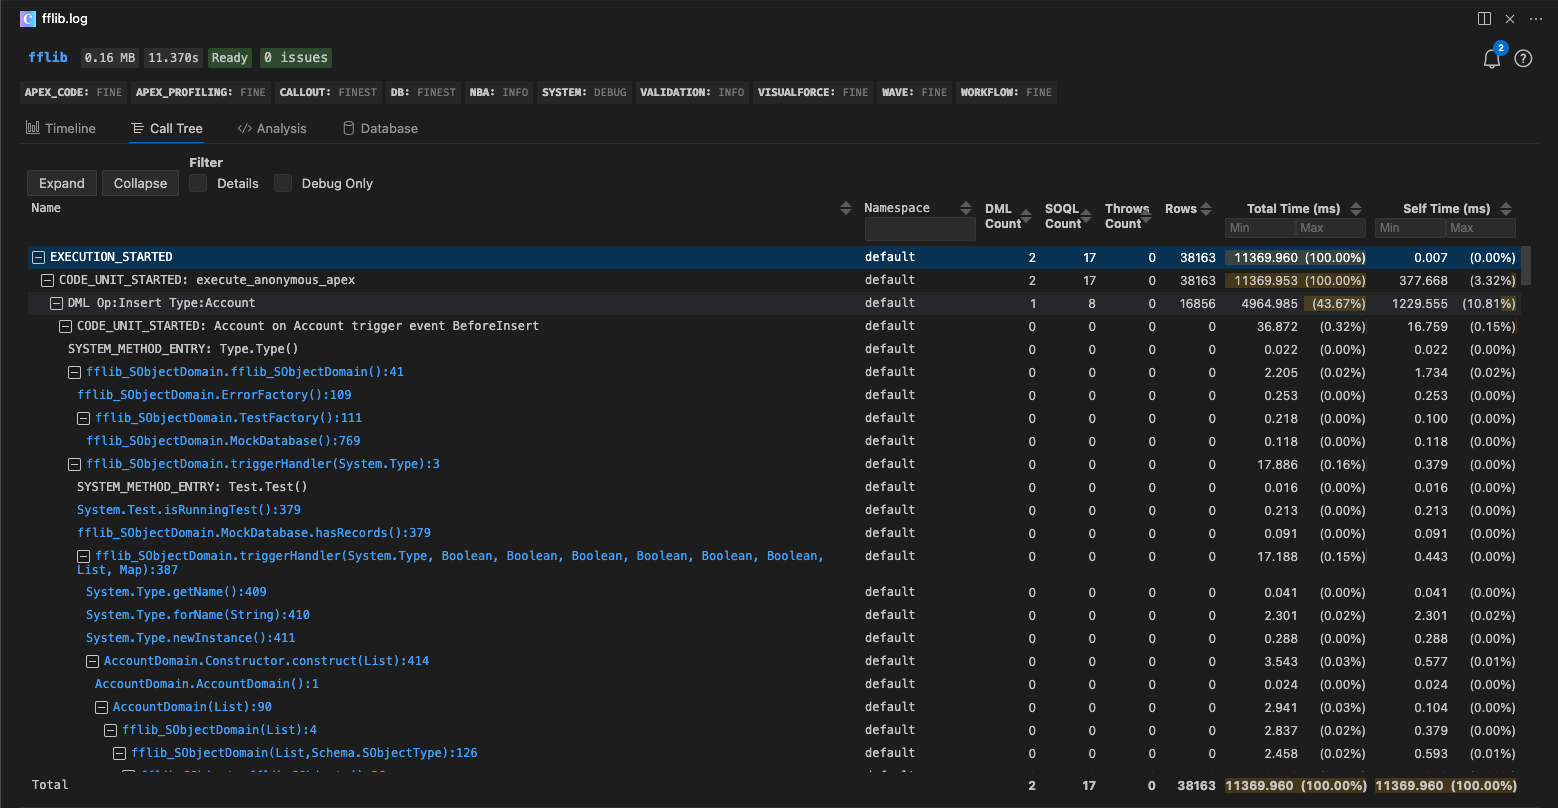
- 🌳 Call Tree - View the execution path in a tree view with aggregated DML Count, SOQL Count, Throws Count, Row Count, Self Time and Total Time. Apply filters to filter the events.
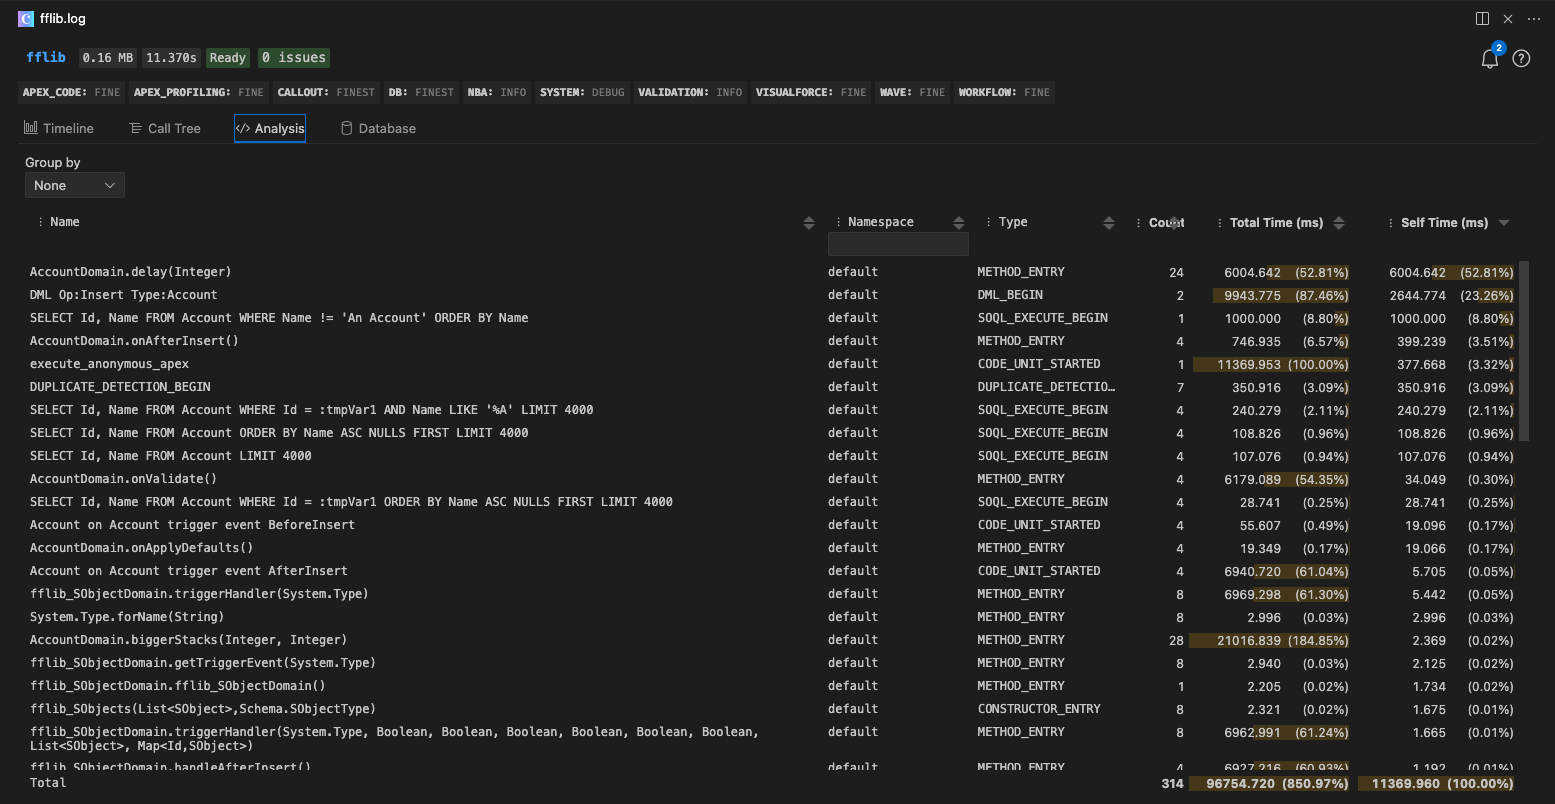
- 🧠 Analysis - Quickly identify which methods took the most time in aggregate.
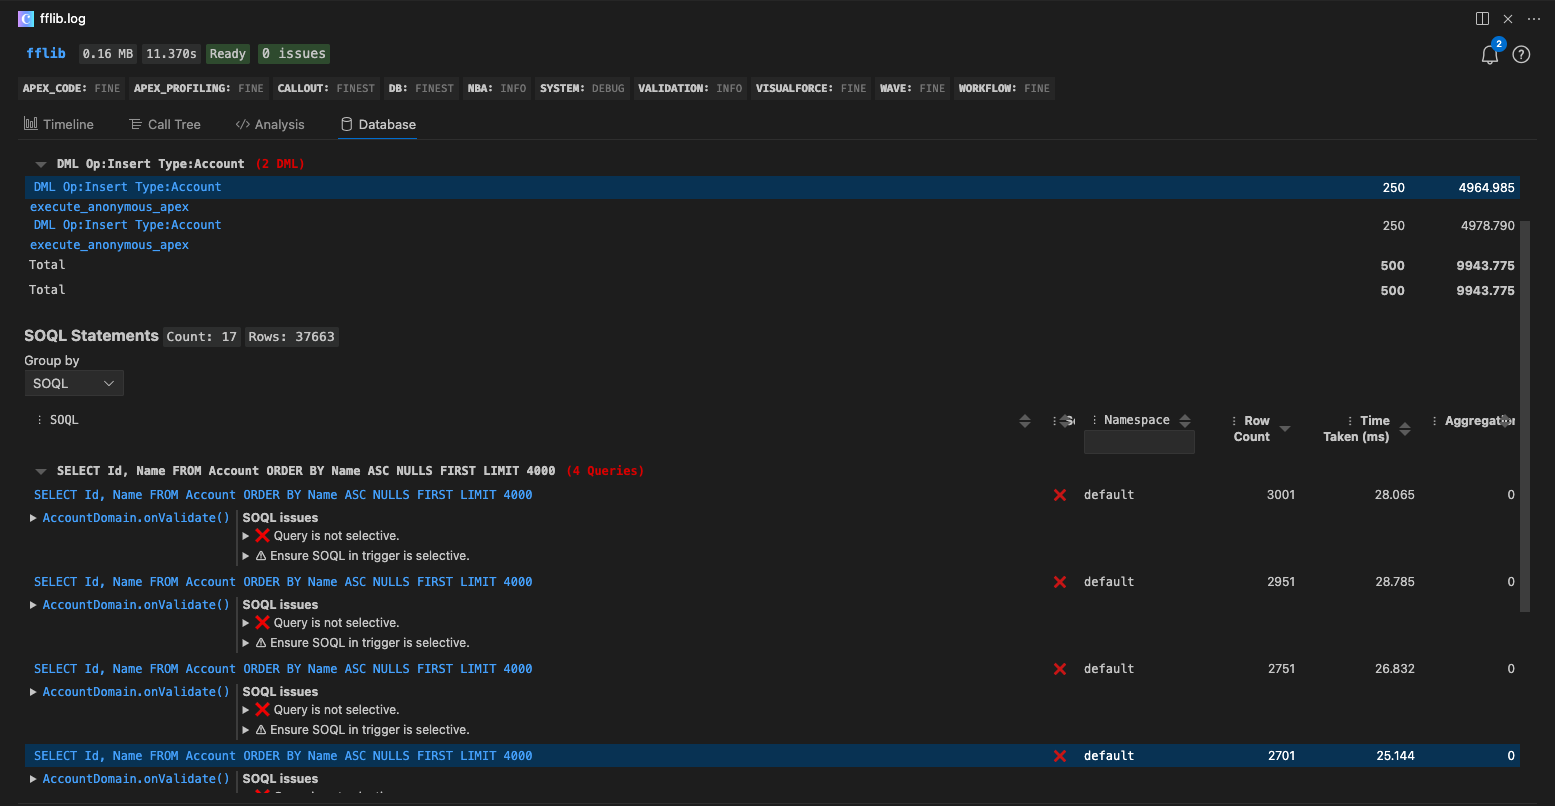
- 💾 Database - Identify which SOQL + DML executed the most, returned the most rows and took the most time.
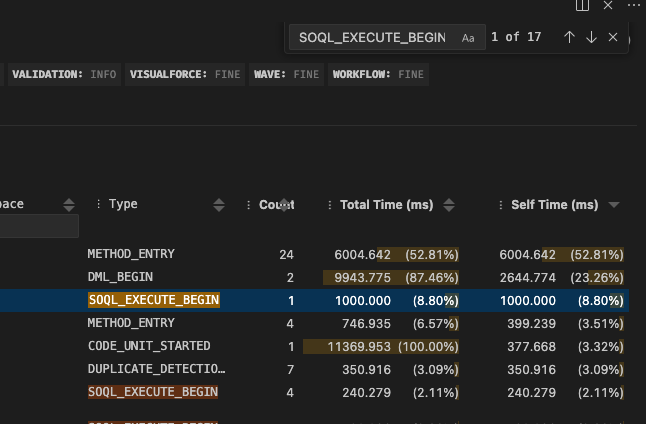
- 🔍 Find - Find, highlight and step through matching text and log events on the Timeline, Call Tree, Analysis
The Timeline shows a visualization of code execution during a request’s execution. Each color represents a different Salesforce event type e.g DB, Method, SOQL etc. The length of a bar relates to realtime taken, a longer bar means that method took longer.
- Scroll up and down with the mouse to zoom in and out to an accuracy of 0.001ms, time markers are shown with a ms time value and white line e.g 9600.001 ms.
- When zooming the mouse pointer position is kept on screen.
- Scroll left and right on the mouse to move the time line left are right, when zoomed
- Click the mouse down and drag to move the timeline around both in the x and y direction, when zoomed
- Clicking an event in the Timeline will go to and select that event in the Call Tree.
- Clicking on an issue in the timeline background will go to and select that event in the Call Tree.
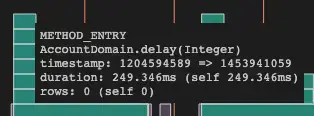
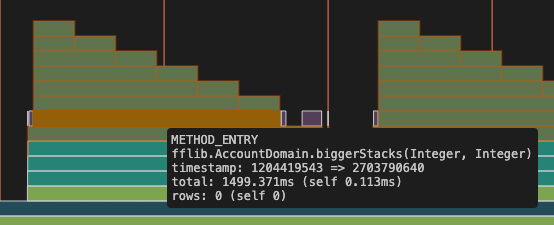
Hovering over an element provides information on the item. If you click on an item it will take you to that row in the Call Tree.
The tooltip provides the following information.
Event Name - e.g METHOD_ENTRY, EXECUTION_STARTED, SOQL_EXECUTION_BEGIN etc
Event Description - Additional information about the event such as method name or SOQL query executed.
Timestamp - The start and end timestamp for the given event which can be cross referenced in the log file.
Duration - Made up of Total Time (time spent in that event and its children) and Self Time (time directly spent in that event).
Rows - Shows Total Rows (rows from that event and its children) and Self Rows (rows directly from that event).
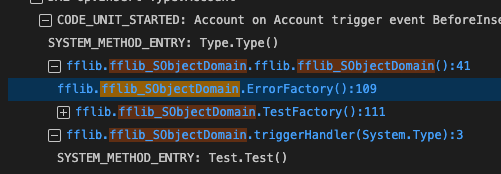
Shows the call stack which can be expanded and collapsed. Clicking on a link will take you to that line in the class if it can be found in the current open project.
Each row shows event type, details such as method signature, self and total time as well as aggregated DML, SOQL, Throws and Row counts.
Clicking the link in the event column will open the corresponding file and line, if that file exists in the current workspace.
Each column can be sorted by clicking the column header, this will sort the rows within the tree structure e.g sorting by self time will sort the children within a parent with the largest self time to the top but only within that parent.
- Details (events with 0 time) are hidden by default but can be shown/ hidden.
- Show only debug statements using the Debug Only filter.
- Show Log events for specific namespaces using the namespace column filter
- Min and Max filtering can be done on the Total Time and Self Time columns.
The Call Tree can be navigated with the keyboard. The up and down keys will move between rows, the left and right keys will expand and collapse a parent within the tree.
Show analysis of method calls by showing Self Time, Total Time, Count (number of times a method was called), name and type. Each column can be sorted ascending or descending by clicking the column header.
By default the Analysis table is sorted with the events that took the longest by Self Time at the top.
Each column can be sorted by clicking the column header, this will sort the rows ascending or descending.
- Show Log events for specific namespaces using the namespace column filter
The rows can be grouped by Type or Namespace
- Namespace: Shows the rows aggregated by their namespace e.g
default,MyNamespace - Type: Shows the rows aggregated by namespace event type e.g
METHOD_ENTRY,DML_ENTRY
Click the header menu,⋮, and use Export to CSV to save the table content to a file.
Focus the Analysis table and use CMD / CTRL + c to copy the table content to clipboard. This can then be pasted into a spreadsheet or other file.
Shows the SOQL and DML that occurred the number of rows returned, the time taken and for SOQL the selectivity and number of aggregations.
The Selectivity column will have a green tick if the query is selective, a red cross if it is not and will be blank if the selectivity could not be determine. Sorting on this column will sort the rows by relative query cost, this number can be seen by hovering the cell on the selectivity column.
The rows can be sorted ascending or descending by DML/SOQL, Row Count and Time Taken and by Selectivity and Aggregations on the SOQL table. By default the rows within each group are sorted descending with the rows that have the highest row count at the top. Row within each group can be sorted by clicking the column header, this will sort the rows ascending or descending.
If the grouping is removed the sorting applies the same but across all rows instead of within each group.
- In the SOQL view show Log events for specific namespaces using the namespace column filter
By default rows are grouped by the SOQL/ DML text, grouping can be removed and the rows shows as a flat list using the Group by item in the header menu. The groups are default sorted with the groups with the most items at the top.
SOQL Statements can also be grouped by package namespace including the default namespace
Clicking a row will show the SOQL/DML call stack, clicking on a link will take you to where that SOQL/DML occurred in the call tree.
For SOQL rows, to the right of the Call Stack is SOQL Analysis which shows information about SOQL performance for the given query and how to improve it.
Click the header menu,⋮, and use Export to CSV to save the table content to a file.
Focus the Analysis table and use CMD / CTRL + c to copy the table content to clipboard. This can then be pasted into a spreadsheet or other file.
- CMD/CTRL + f to open find
- Any matching text is highlighted, the current match has a lighter hightlight.
- Previous match, next match and case sensitive search all supported.
- If the next matching event is off screen that event will be centered on the timeline.
- The find will match on Event Type or text in the event
- The tooltip is shown for the current matching event, making it easy to view the event details such as Total or Self time.
- If the next matching text is within a parent that parent will be expanded.
- The row with the current matching text will also be highlighted
- If the next matching text is within a group that group will be expanded.
- The row with the current matching text will also be highlighted
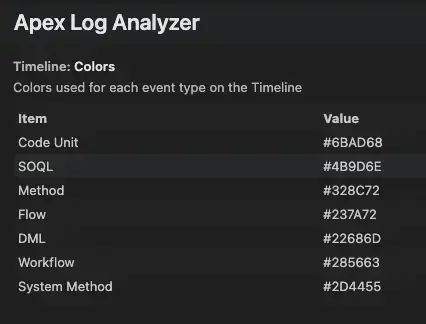
The default colors shown on the timeline can be changed in the VSCode settings.
Either in the UI preferences -> extensions -> Apex Log Analyzer
or
settings.json
"lana.timeline.colors": {
  "Code Unit": "#88AE58",
  "Workflow": "#51A16E",
  "Method": "#2B8F81",
  "Flow": "#337986",
  "DML": "#285663",
  "SOQL": "#5D4963",
  "System Method": "#5C3444"
}Help us to make things better by Contributing
Find out how to Build the extension
Thanks to the everyone who has contributed ❤️ 🙏;
Copyright © Certinia Inc. All rights reserved.


