This section provides a step-by-step guide to setting up a demo environment for Open Telemetry Auto-instrumentation in NodeJS.
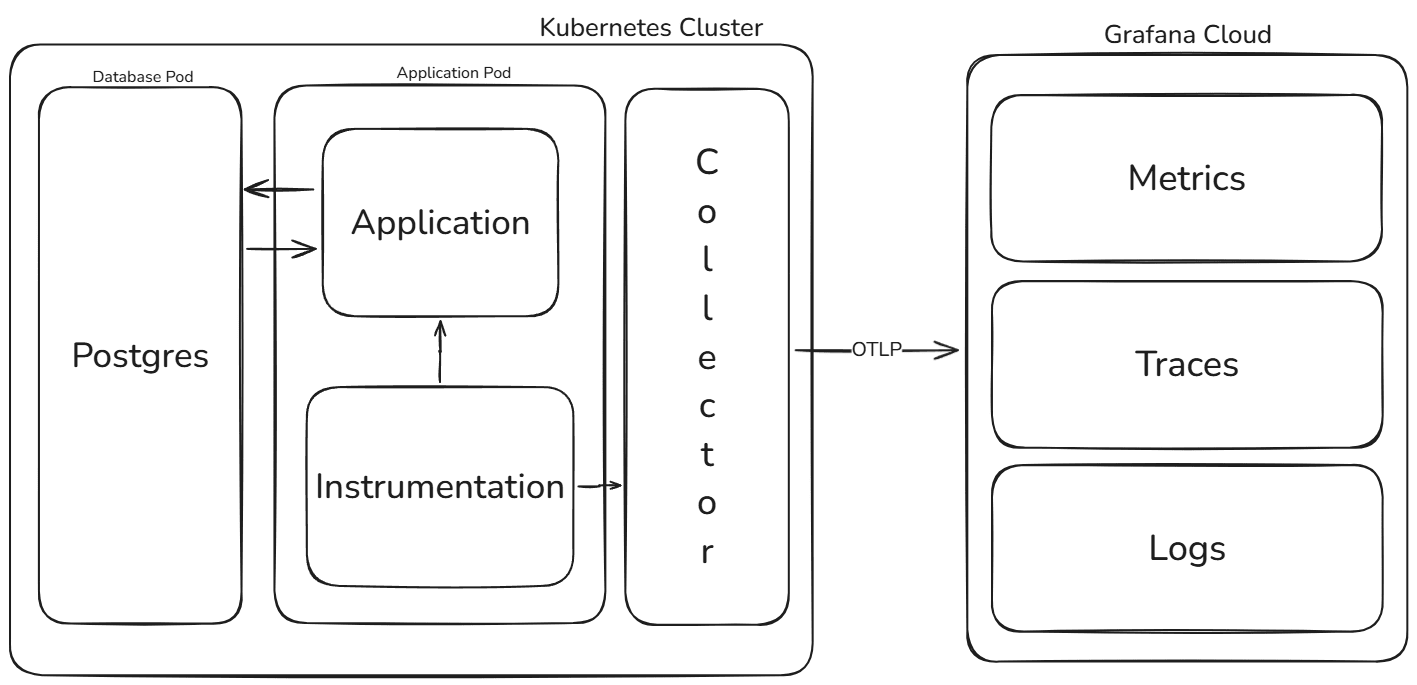
In this demo, we will deploy a simple to-do application written in Node.js to our Kubernetes cluster. This application allows users to manage their activities interactively, providing a simple approach for showing the setup. To improve observability and monitor the application's behavior, we will integrate Grafana Cloud for log and metric visualization. Grafana will help us monitor the application's health and performance in real-time, helping us identify potential difficulties and gaining insights into its operations. Once everything is set up, we will validate the integration by visualizing the logs and metrics in Grafana, providing a comprehensive view of the application's performance.
-
Kubernetes cluster
We are usingkindbut you can use any Kubernetes cluster. Install kind and create a cluster with the following command:kind create cluster
-
Cert-Manager
Inorder to install the OpenTelemetry Operator we need to install
cert-manager
kubectl apply -f [https://github.com/cert-manager/cert-manager/releases/download/v1.16.3/cert-manAger.yaml](https://github.com/cert-manager/cert-manager/releases/download/v1.16.3/cert-manAger.yaml) OpenTelemetry Operator
kubectl apply -f [https://github.com/open-telemetry/opentelemetry-operator/releases/latest/download/opentelemetry-operator.yaml](https://github.com/open-telemetry/opentelemetry-operator/releases/latest/download/opentelemetry-operator.yaml) Clone this repo https://github.com/cloudraftio/nodejs-otel-auto-instrumentation.
Then navigate to the deployment section of the repo. There are three yaml configurations named deployment.yaml, collector.yaml and instrumentation.yaml file.
Deployment.yaml:This configuration file consists the information about our application deployment. It includes the following resources: Deployment, Services, ConfigMaps, Secrets and a Namespace. Here we see annotations are added to the existing deployments; this is required to make sure the instrumentation is correctly configured for OpenTelemetry auto-instrumentation.
instrumentation.opentelemetry.io/inject-nodejs: "true"
instrumentation.opentelemetry.io/nodejs-container-names: todo-app
Telemetry data such as traces and metrics without the need for extensive manual coding. These annotations help the OpenTelemetry agent to automatically detect and instrument the application, ensuring that performance monitoring and observability are efficiently integrated into the deployment process.
2. Collector.yaml: This is the OpenTelemetry Collector configurations which collects the data from the Instrumentation and send it to the backend (here Grafana Cloud).
3. Instrumentation.yaml: This is the OpenTelemetry Instrumentation configuration which runs as a init-container in the applications Pod. It identifies the pod where the required auto-instrumentations annotations are configured.
Navigate to the collector.yaml file and edit with your Grafana Cloud OTLP Authentication.
- Go on to your Grafana Cloud OTLP Configuration: https://grafana.com/orgs//stacks//otlp-info
- Set the endpoint in the
collector.yamlto OTLP Endpoint mentioned in your Grafana Cloud - Generate a Password/API token to access your Grafana Instance and encode the
username:passwordin base64 encoding. Example theInstanceID: 1105050 API/Password: gcs_kTKUeyQkWefHQEot5e8RvWsLDVF23CH3lF0wjpBy7eYq4QDMFs
Result:echo -n '1105050:gcs_kTKUeyQkWefHQEot5e8RvWsLDVF23CH3lF0wjpBy7eYq4QDMFs' | base64
MTEwNTA1MDpnY3Nfa1RLVWV5UWtXZWZIUUVvdDVlOFJ2V3NMRFZGMjNDSDNsRjB3anBCeTdlWXE0UURNRnM= - Copy the encoded value and paste it into the Authorization section of the
collector.yaml.
When the pod starts up, the annotation tells the Operator to look for an Instrumentation object in the pod’s namespace, and to inject auto-instrumentation into the pod. It adds an init-container to the application’s pod, called opentelemetry-auto-instrumentation, which is then used to injects the auto-instrumentation into the app container. If the Instrumentation resource isn’t present by the time the application is deployed, however, the init-container can’t be created. Therefore, if the application is deployed before deploying the Instrumentation resource, the auto-instrumentation will fail.
kubectl apply -f deployment.yaml
kubectl apply -f instrumentation.yaml
kubectl apply -f collector.yaml
Delete the todo-app-<> pod inorder to start the init-container.
Making some sample requests to the web services
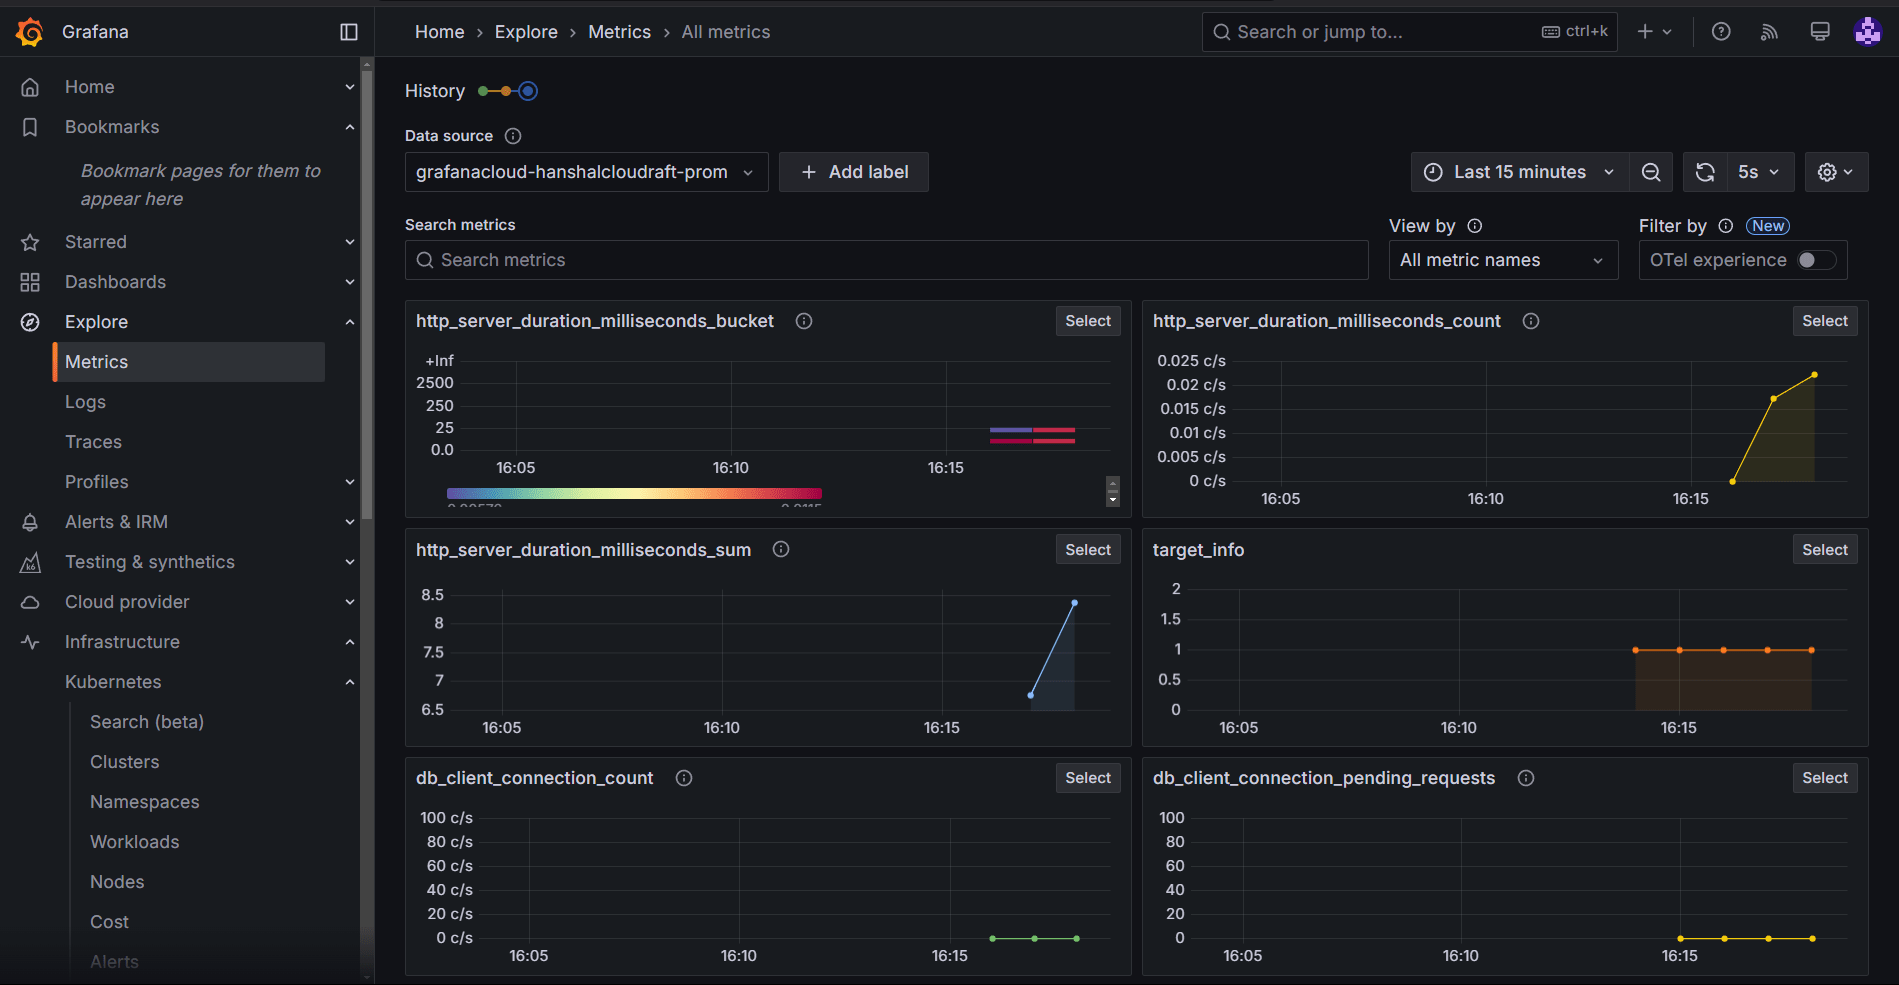
kubectl port-forward svc/todo-app-service 3000:3000 -n otel-autoNow navigate to your Grafana Cloud Default Metrics section. Here you can see various metrics: http_server_duration_millisecond_count, http_client_duration_millisecond_count, etc.
We have created a sample dashboard to visualize your metrics. This repository contains the panel.json file which you can import in your dashboards and use it.
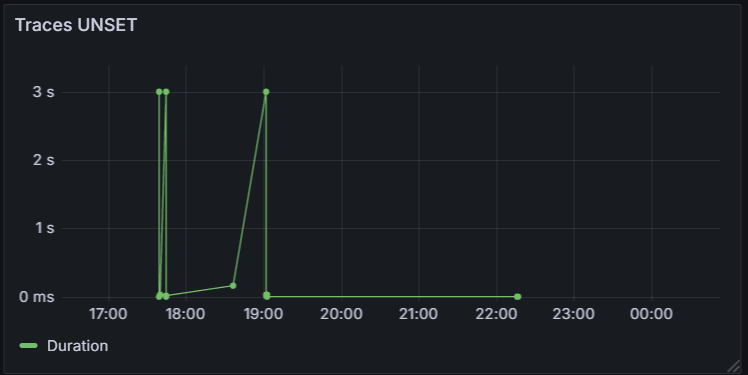
Now here you can look for all the metrics with zero-code instrumentation of Open Telemetry aka Auto-Instrumentation.
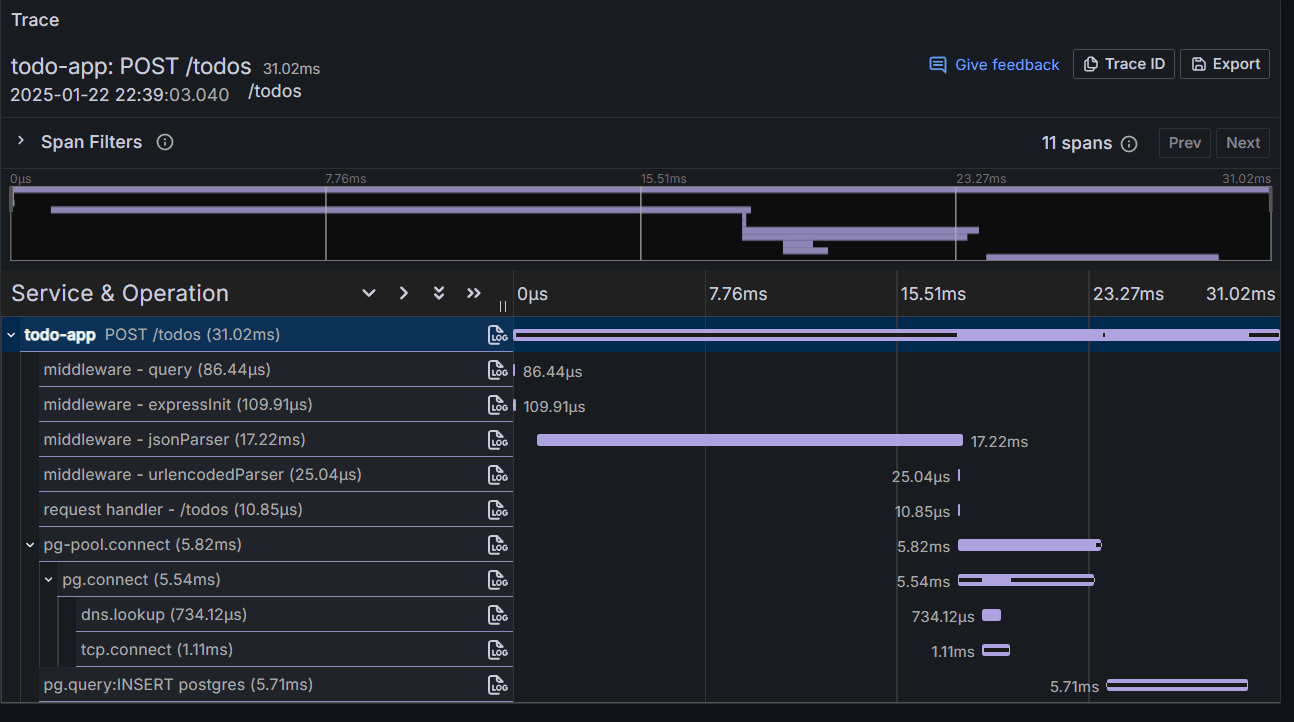
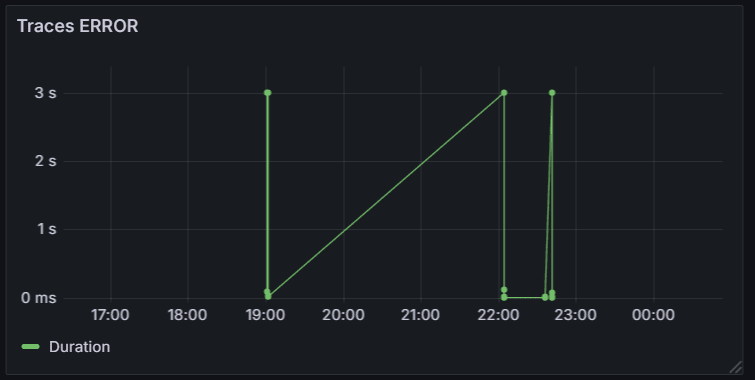
Let’s see a few traces generated by the instrumentation

