This Python script acts as a gdbserver for debugWIRE MCUs, e.g., for the ATmega328P. It can communicate with Microchip debuggers such as Atmel-ICE and MPLAB SNAP (in AVR mode), and it provides a pass-through service for the DIY hardware debugger dw-link. For Microchip debuggers, the Python script uses the infrastructure provided by pymcuprog and pyedgblib to implement a full-blown gdbserver. With dw-gdbserver, you can utilize the GDB debuggers integrated into IDEs such as Arduino IDE 2 or PlatformIO.
- dw-gdbserver
- Switching SNAP and PICkit4 to AVR mode
- Installation
- Usage
- Command line options
- How to get into and out of debugWIRE mode
- Monitor commands
- Connecting a debugWIRE Debugger to a Target
- Integrated Development Environments and Graphical User Interfaces
- List of supported and tested hardware debuggers
- List of supported and tested MCUs
- Notes for Linux systems
- What the future has in store for us
Table of contents generated with markdown-toc
Switching to AVR mode in the SNAP debugger is easily accomplished by using avrdude (>= Version 7.3):
> avrdude -c snap_isp -Pusb -xmode=avr
With PICkit4 it is similar:
> avrdude -c pickit4_isp -Pusb -xmode=avr
In both cases, you can check whether you were successful by typing the same command again. If you get the message that the debugger is still in 'PIC' mode, you need to flash new firmware first using MPLAB X.
If you want to use dw-gdbserver as part of Arduino IDE 2, you do not need to install it explicitly. It is enough to add an "additional boards manager URL" and install the respective core. As a Linux user, you may have to set additionally some permissions.
Go to the GitHub page (if you are not already there), select the latest release (right-hand side of page), download the archive with the binary for your architecture, and untar the archive. It contains the executable dw-gdbserver and a folder dw-gdbserver-util. Store both of them somewhere in the same folder and include this folder in your PATH variable.
Since the binaries were generated on very recent versions of the respective operating systems (Windows 11, MacOS 15.4, Ubuntu 24.04), it can happen that the binary is not compatible with your operating system. In this case, you can use one oft the methods below.
I assume you already installed a recent Python version (>=3.9).
It will be necessary to install pipx first. If you have not done so, follow the instructions on the pipx website. Then proceed as follows.
> pipx install dwgdbserver
> pipx ensurepath
> sudo ~/.local/bin/dw-gdbserver --install-udev-rules
After unplugging and replugging the debugger and restarting your shell, you can invoke the gdbserver by simply typing dw-gdbserver into a shell. The binary is stored under ~/.local/bin/
> pipx install dwgdbserver
> pipx ensurepath
After restarting the shell, you should be able to start the gdbserver. The binary is stored under ~/.local/bin/
Alternatively, you can download or clone the GitHub repository. You need then to install the package poetry:
> pipx install poetry
With that, you can start executing the script inside the downloaded folder as follows:
> poetry install
> poetry run dw-gdbserver ...
Furthermore, you can create a binary standalone package as follows:
> poetry run pyinstaller dw-gdbserver.spec
After that, you find an executable dw-gdbserver (or dw-gdbserver.exe) in the directory dist/dw-gdbserver/ together with the folder dw-gdbserver-util. You can copy those to a place in your PATH. If you want to generate a binary on a Mac that can be shipped to other Macs, you should use arm64-apple-dw-gdbserver.spec or intel-apple-dw-gdbserver.spec in order to include libusb.
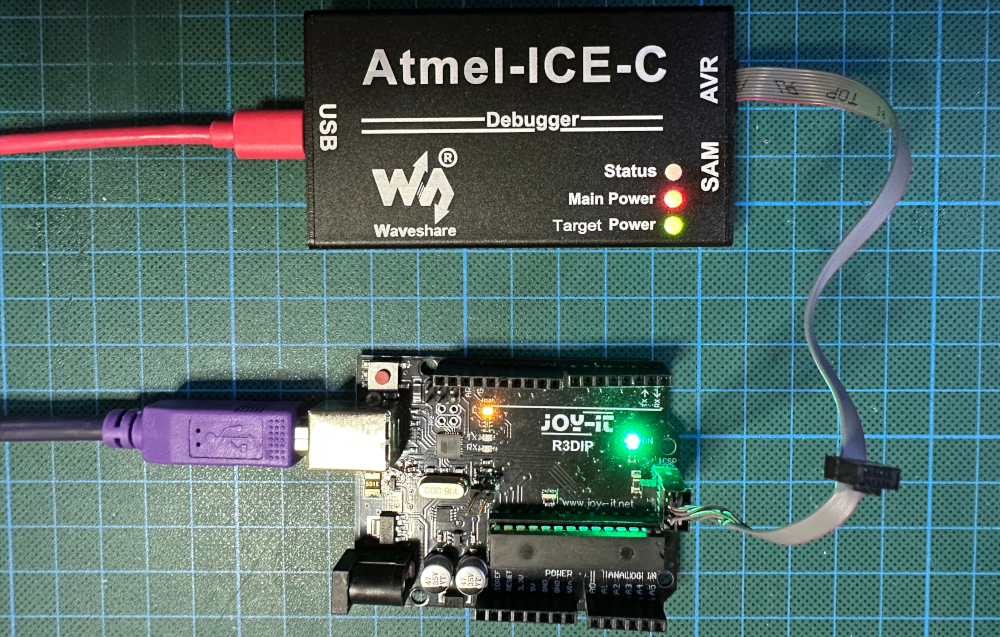
If your target board is an Arduino board, you must modify it by disconnecting the capacitor responsible for the auto-reset feature.
Once you have connected a hardware debugger to your target board, you can start the gdbserver in a terminal window.
> dw-gdbserver -d atmega328p
[INFO] Connecting to anything possible
[INFO] Connected to Atmel-ICE CMSIS-DAP
[INFO] Starting dw-gdbserver
[INFO] Looking for device atmega328p
[INFO] Listening on port 2000 for gdb connection
In another terminal window, you can now start a GDB session:
> avr-gdb <progname>.elf
GNU gdb (GDB) 15.2
Copyright (C) 2024 Free Software Foundation, Inc.
...
(gdb) target remote :2000
Remote debugging using :2000
0x00000000 in __vectors ()
(gdb) monitor debugwire
debugWIRE mode is disabled
(gdb) monitor debugwire enable
*** Please power-cycle the target system ***
Ignoring packet error, continuing...
debugWIRE mode is enabled
(gdb) load
Loading section .text, size 0x596 lma 0x0
Start address 0x00000000, load size 1430
Transfer rate: 1 KB/sec, 1430 bytes/write.
(gdb) break loop
Breakpoint 1 at 0x470: file /Users/.../varblink0.ino, line 13.
Note: automatically using hardware breakpoints for read-only addresses.
(gdb) continue
...
If, instead of using a CLI, you want to use an IDE (e.g., Arduino IDE 2) or GUI, there are a couple of options.
| Optionname | Description |
|---|---|
--device -d |
The argument to this option specifies the MCU type of the target chip in lower case. This option is mandatory. If a '?' mark is given, all supported MCUs are listed. |
--gede-g |
No argument for this option. This option will start the Gede debugger GUI. |
--port -p |
IP port on the local host to which GDB can connect. |
--start -s |
Program to start or the string noop, when no program should be started |
--tool-t |
Specifying the debug tool. Possible values are atmelice, edbg, jtagice3, medbg, nedbg, pickit4, powerdebugger, snap, dwlink. Use of this option is necessary only if more than one debugging tool is connected to the computer. |
--usbsn -u |
USB serial number of the tool. This is only necessary if one has multiple debugging tools connected to the computer. |
--verbose -v |
Specify verbosity level. Possible values are debug, info, warning, error, or critical. The default is info. |
--version -V |
Print dw-gdbserver version number and exit. |
--install-udev-rules |
Install the udev rules necessary for Microchip's EDBG debuggers. Needs to be run with sudo and is only present under Linux. |
When the MCU is not already in debugWIRE mode, you must request the switch to debugWIRE mode using the command monitor debugwire enable in GDB. The debugger will then enable the DWEN fuse and either power-cycles the target by itself (if possible) or ask you to power-cycle the target system. Once this is done, the chip will stay in debugWIRE mode, even after terminating the debugging session. In other words, when starting the next debug session, the MCU is already in debugWIRE mode. You can switch back to normal mode using the command monitor debugwire disable before leaving the debugger.
In addition to the above mentioned command for enabling debugWIRE mode, there are a few other monitor commands.
| Command | Action |
|---|---|
monitor breakpoints [all|software|hardware] |
Restricts the kind of breakpoints the hardware debugger can use. Either all types are permitted, only software breakpoints are allowed, or only hardware breakpoints can be used. Using all kinds is the default. |
monitor caching [enable|disable] |
The loaded executable is used as a cache in the gdbserver when enabled, which is the default. |
monitor debugwire [enable|disable] |
DebugWIRE mode will be enabled or disabled. When enabling it, the MCU will be reset and you may be asked to power-cycle the target. After disabling debugWIRE mode, the MCU can be programmed again using SPI programming. |
monitor help |
Display help text. |
monitor info |
Display information about the target and the state of the debugger. |
monitor load [readbeforewrite|writeonly] |
When loading an executable, either each flash page is compared with the content to be loaded, and flashing is skipped if the content is already there, or each flash page is written without reading the current contents beforehand. The first option is the default option and there is no reason to change it. |
monitor onlyloaded [enable|disable] |
Execution is only possible when a load command was previously executed, which is the default. If you want to start execution without previously loading an executable, you need to disable this mode. |
monitor rangestepping [enable|disable] |
The GDB range-stepping command is supported or disabled. |
monitor reset |
Resets the MCU. |
monitor singlestep [safe|interruptible] |
Single-stepping can either be performed in a safe way, where single steps are shielded against interrupts or in the default way, where a single step can lead to a jump into the interrupt dispatch table. The safe option is the default. |
monitor timer [freeze|run] |
Timers can either be frozen when execution is stopped, or they can run freely. The later option is helpful when PWM output is crucial. |
monitor verify [enable|disable] |
Verify flash after loading each flash page. The cost for verifying is negligible, and doing so might diagnose flash wear problems. The default is that this option is enabled. |
monitor version |
Show version of the gdbserver. |
The default setting is always the first one listed, except for debugwire, which depends on the MCU itself. All commands can, as usual, be abbreviated. For example, mo d e is equivalent to monitor debugwire enable.
In principle, only two lines are necessary to connect your hardware debugger to a target chip or board: the debugWIRE line, which is the target chip's RESET line, and GND. However, when one wants to change into and out of debugWIRE mode, change fuses, or upload firmware, it is necessary to connect all 6 SPI programming lines to the target: VTG, GND, RESET, MOSI, MISO, and SCK. For this reason, using all SPI programming lines makes a lot of sense. Moreover, most of the time, an SPI connector is already on the target board.
There are two types of SPI programming connectors. The more recent type has six pins, and the older type has 10 pins, as shown in the following diagram (based on a diagram from Wikipedia https://commons.wikimedia.org/wiki/user:Osiixy), which provides a top view of the headers on a PCB.

Note the notches on the left side of the headers. Since almost all SPI programming plugs are keyed, you can only plug them in in the correct orientation. However, the headers sometimes do not have notches. In this case, pin 1 is usually marked in some way, either with a dot, a star, or with the number 1. Similarly, plugs also come unkeyed. In this case, again, pin 1 is marked in some way.
If the target board has an SPI programming header, it is easy to connect to it. Atmel-ICE, Power Debugger, and JTAGICE3 have a cable you can plug into a 6-pin SPI programming header. If you only have a 10-pin header on the target, you need an adapter. PICKit4 and SNAP do not come with SPI programming headers. However, you can buy an AVR programming adapter from Microchip, an adapter PCB from OSH Park, or a more luxurious version from eBay. Finally, for dw-link, I propose preparing a modified SPI programming cable or buying the dw-link probe programmer shield, which has an SPI programming header on board.
If the target does not feature an SPI programming header, you need to connect 6 cables. If you are working with a breadboard, you may consider buying an SPI header breadboard adapter. Otherwise, you need to connect each pin individually. Atmel-ICE, Power Debugger, and JTAGICE3 have a so-called 10-pin mini-squid cable. The pin mapping for those debuggers is as follows.
| Atmel Debugger | Mini-squid pin | Target pin | SPI pin |
|---|---|---|---|
| Pin 1 (TCK) | 1 | SCK | 3 |
| Pin 2 (GND) | 2 | GND | 6 |
| Pin 3 (TDO) | 3 | MISO | 1 |
| Pin 4 (VTG) | 4 | VTG | 2 |
| Pin 5 (TMS) | 5 | ||
| Pin 6 (nSRST) | 6 | RESET | 5 |
| Pin (N.C.) | 7 | ||
| Pin 8 (nTRST) | 8 | ||
| Pin 9 (TDI) | 9 | MOSI | 4 |
| Pin 10 (GND) | 0 |
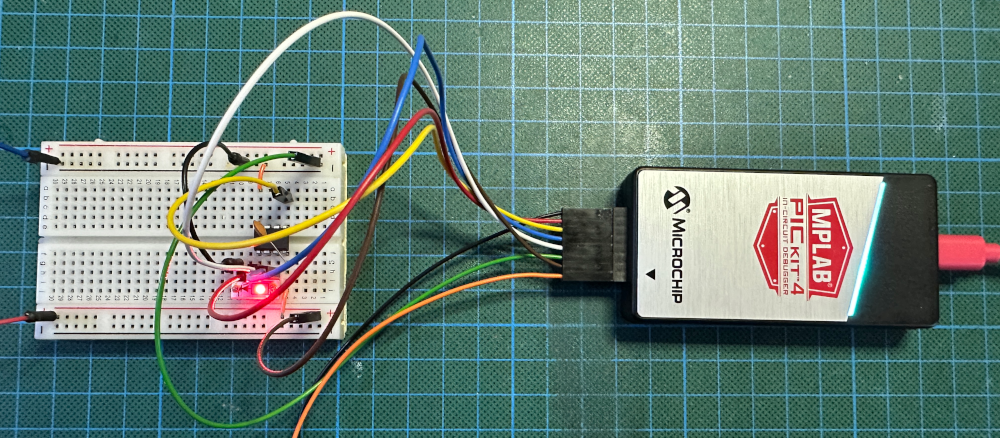
For PICkit4 and SNAP, such a table looks as follows, with pin 1 marked by a triangle.
| MBLAP Debugger | Pin # | Target pin | SPI pin |
|---|---|---|---|
| Pin 1 (TVPP) | 1 | ||
| Pin 2 (TVDD) | 2 | VTG | 2 |
| Pin 3 (GND) | 3 | GND | 6 |
| Pin 4 (PGD) | 4 | MISO | 1 |
| Pin 5 (PGC) | 5 | SCK | 3 |
| Pin 6 (TAUX) | 6 | RESET | 5 |
| Pin 7 (TTDI) | 7 | MOSI | 4 |
| Pin 8 (TTMS) | 8 |
When you want to connect a dw-link debugger without a dw-link probe shield to a target, you can use jumper cables using the following pin mapping.
| dw-link Arduino Uno pins | Target pin | SPI pin |
|---|---|---|
| D8 | RESET | 5 |
| D11 | MOSI | 4 |
| D12 | MISO | 1 |
| D13 | SCK | 3 |
| 5V (if powered by debugger) | Vcc | 2 |
| GND | GND | 6 |
With a dw-link probe shield, it is best to construct or buy a cable with a 6-pin SPI programming plug on one end and single DuPont pins on the other.
When using one of the commercial debuggers, you need to power the target board from an external source. With dw-link, you can choose to power the target board from the debugger or an external source.
There are several possible options for using an IDE or a GUI that make use of dw-gdbserver to enable a debugging solution.
Arduino IDE 2 is probably the most straightforward option. You only need to add Additional Boards Manager URL in the Preference dialog:
https://felias-fogg.github.io/ATTinyCore/package_drazzy.com_ATTinyCore_index.json
After that, you must install the respective cores, which enables you to debug almost all classic AVR chips (MiniCore and MicroCore will come soon!). And this is all! Now, you can press the debug button and start debugging. See, e.g., this short tutorial about debugging in the Arduino IDE 2
Linux users may need to add a few udev rules. When you first start the Arduino IDE debugger and the hardware debuggers are not recognized, you will get a hint in the gdb-server window of how to set the udev rules. You simply have to execute dw-gdbserver once using the command line option --install-udev-rules.
PlatformIO is a cross-platform, cross-architecture, multiple framework professional tool for embedded systems engineers. Installed as an extension to the popular Visual Studio Code, it provides a powerful IDE for embedded programming and debugging. Using the platformio.ini file, integrating an external debugging framework is very easy. If you want to debug a program on an ATmega328P, the platformio.ini file could look as follows:
[platformio]
default_envs = debug

[env:debug]
extends = env:atmega328p              ;; <--- substitute the right board here
build_type = debug
debug_tool = custom
debug_server = /path/to/dw-gdbserver  ;; <-- specify path to gdbserver
    --port=3333
    --device=${env:debug.board}
debug_init_cmds =
    define pio_reset_halt_target
         monitor reset
    end
    define pio_reset_run_target
         monitor reset
	       continue
    end
    target remote $DEBUG_PORT
    monitor debugwire enable
    $LOAD_CMDS
    $INIT_BREAK
debug_build_flags =
    -Og
    -ggdb3

[env:atmega328p]
platform = atmelavr
framework = arduino
board = ATmega328P
board_build.f_cpu = 16000000L
board_hardware.oscillator = external
Note that the debug environment should be the default one. It should be the first if no default environment has been declared.
I further noticed that the avr-gdb debugger in the PlatformIO toolchain is quite dated and often does not start (e.g. under Ubuntu 24.04). Simply replace it with a more recent version from /usr/bin or /usr/local/bin, perhaps after haing it installed with you local packet manager.
Gede is a lean and clean GUI for GDB. It can be built and run on almost all Linux distros, FreeBSD, and macOS. You need an avr-gdb client with a version >= 10.2. If you have installed Gede somewhere in your PATH, you can start it by specifying the option --gede or -g when starting dw-gdbserver.
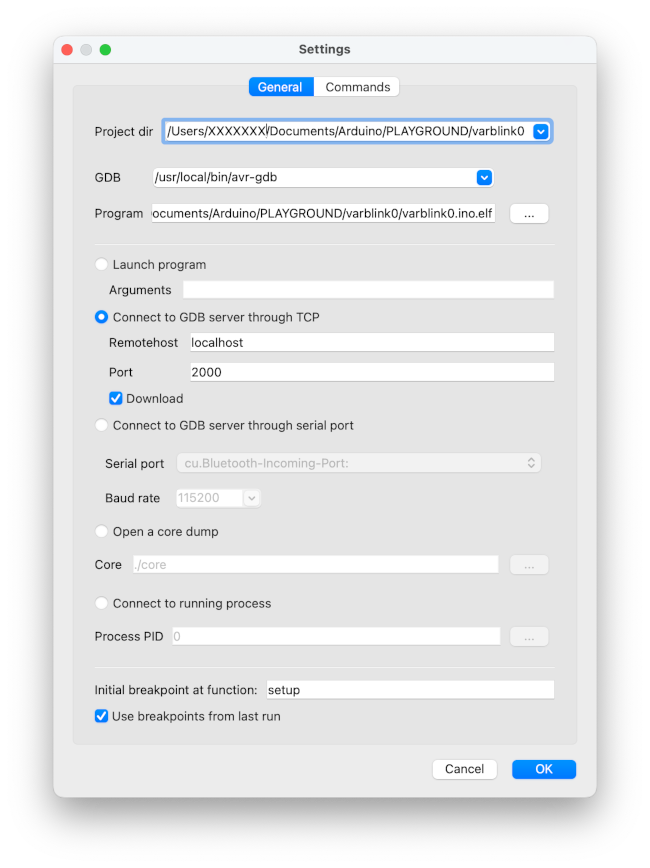
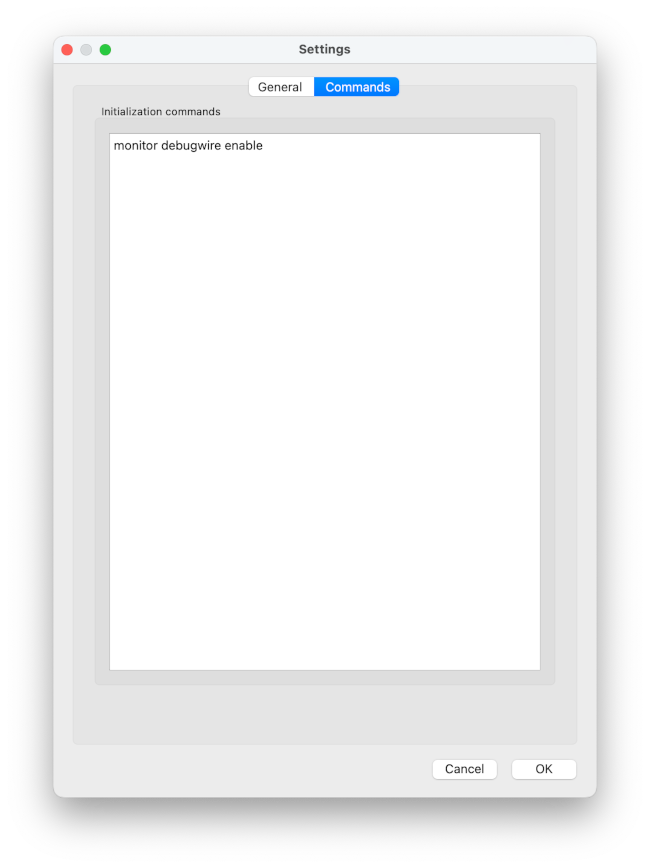
Project dir and Program are specific to your debugging session. The rest should be copied as it is shown. Before you click OK, you should switch to the Commands section, where you need to enter the command monitor debugwire enable.
Clicking on OK, you start a debugging session. The startup may take a while because the debugger always loads the object file into memory.
Except for dw-link, this list is copied from the readme file of pyedbglib. Boldface means that the debuggers have been tested by me and work with this Python script.
- MPLAB PICkit 4 In-Circuit Debugger (when in 'AVR mode')
- MPLAB Snap In-Circuit Debugger (when in 'AVR mode')
- Atmel-ICE
- Atmel Power Debugger
- mEDBG - on-board debugger on Xplained Mini/Nano
- JTAGICE3 (firmware version 3.0 or newer)
- dw-link - DIY debugWIRE debugger running on an Arduino UNO R3
This is the list of all debugWIRE MCUs, which should all be compatible with dw-gdbserver. MCUs tested with this Python script are marked bold. MCUs known not to work with the script are struck out. For the list of MCUs compatible with dw-link, you need to consult the dw-link manual.
- ATtiny13
- ATtiny43U
- ATtiny2313(A), ATtiny4313
- ATtiny24(A), ATtiny44(A), ATtiny84(A)
- ATtiny441, ATtiny841
- ATtiny25, ATtiny45, ATtiny85
- ATtiny261(A), ATtiny461(A), ATtiny861(A)
- ATtiny87, ATtiny167
- ATtiny828
- ATtiny48, ATtiny88
- ATtiny1634
ATmega48, ATmega48A, ATmega48PA, ATmega48PB,ATmega88, ATmega88A, ATmega88PA, Atmega88PB,- ATmega168, ATmega168A, ATmega168PA, ATmega168PB,
- ATmega328, ATmega328P, ATmega328PB
The ATmega48 and ATmega88 (without the A-suffix) sitting on my desk suffer from stuck-at-one bits in the program counter and are, therefore, not debuggable by GDB. I suspect that this applies to all chips labeled this way. In any case, the test for stuck-at-one-bits is made when connecting to the chips.
- ATmega8U2, ATmega16U2, ATmega32U2
- ATmega32C1, ATmega64C1, ATmega16M1, ATmega32M1, ATmega64M1, ATmegaHVE2
- AT90USB82, AT90USB162
- AT90PWM1, AT90PWM2B, AT90PWM3B
- AT90PWM81, AT90PWM161
- AT90PWM216, AT90PWM316
- ATmega8HVA, ATmega16HVA, ATmega16HVB, ATmega32HVA, ATmega32HVB, ATmega64HVE2
The following text is copied verbatim from the README of pyedbglib. The udev rules will be added when you call dw-gdbserver with the option --install-udev-rules in sudo-mode. Permission for serial lines, as described in the end, needs to be set manually. However, the hardware debuggers only use USB.
HIDAPI needs to build using packages: libusb-1.0.0-dev, libudev-dev
USB devices need udev rules to be added to a file in /etc/udev/rules.d Example of udev rules for supported debuggers:
# HIDAPI/libusb:

# JTAGICE3
SUBSYSTEM=="usb", ATTRS{idVendor}=="03eb", ATTRS{idProduct}=="2140", MODE="0666"
# Atmel-ICE
SUBSYSTEM=="usb", ATTRS{idVendor}=="03eb", ATTRS{idProduct}=="2141", MODE="0666"
# Power Debugger
SUBSYSTEM=="usb", ATTRS{idVendor}=="03eb", ATTRS{idProduct}=="2144", MODE="0666"
# EDBG - debugger on Xplained Pro
SUBSYSTEM=="usb", ATTRS{idVendor}=="03eb", ATTRS{idProduct}=="2111", MODE="0666"
# EDBG - debugger on Xplained Pro (MSD mode)
SUBSYSTEM=="usb", ATTRS{idVendor}=="03eb", ATTRS{idProduct}=="2169", MODE="0666"
# mEDBG - debugger on Xplained Mini
SUBSYSTEM=="usb", ATTRS{idVendor}=="03eb", ATTRS{idProduct}=="2145", MODE="0666"
# PKOB nano (nEDBG) - debugger on Curiosity Nano
SUBSYSTEM=="usb", ATTRS{idVendor}=="03eb", ATTRS{idProduct}=="2175", MODE="0666"
# PKOB nano (nEDBG) in DFU mode - bootloader of debugger on Curiosity Nano
SUBSYSTEM=="usb", ATTRS{idVendor}=="03eb", ATTRS{idProduct}=="2fc0", MODE="0666"
# MPLAB PICkit 4 In-Circuit Debugger
SUBSYSTEM=="usb", ATTRS{idVendor}=="03eb", ATTRS{idProduct}=="2177", MODE="0666"
# MPLAB Snap In-Circuit Debugger
SUBSYSTEM=="usb", ATTRS{idVendor}=="03eb", ATTRS{idProduct}=="2180", MODE="0666"
pyedbglib also provides helper functions for accessing serial ports. The user has to be part of the 'dialout' group to allow this. This can be done by executing:
sudo adduser $USER dialoutIt may also be necessary to grant read+write permission to the port, for example:
sudo chmod a+rw /dev/ttyACM0
The script has all the basic functionality and seems to work pretty well.
I also plan to provide binaries, which can be used as tools for the Arduino IDE 2. And if it all works, it is only a "tiny" step to generalize it to the JTAG and/or UPDI AVR MCUs. So, stay tuned.