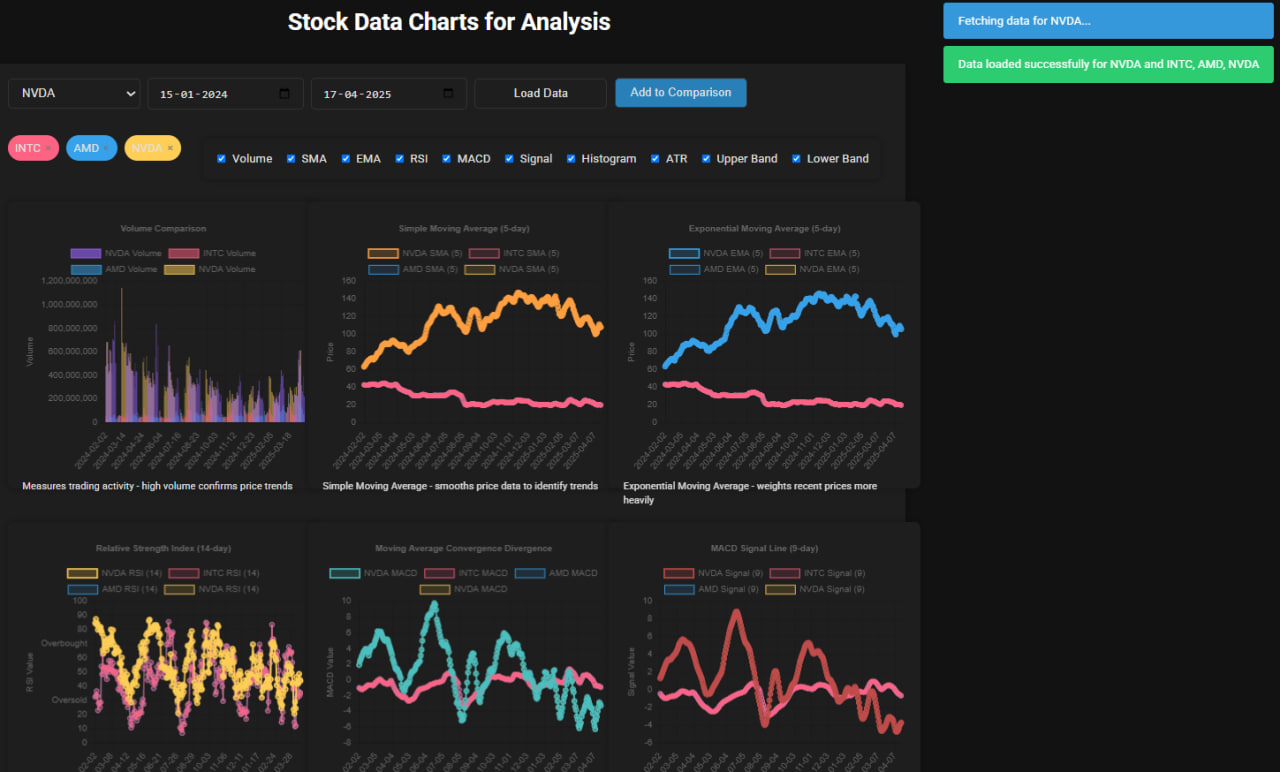
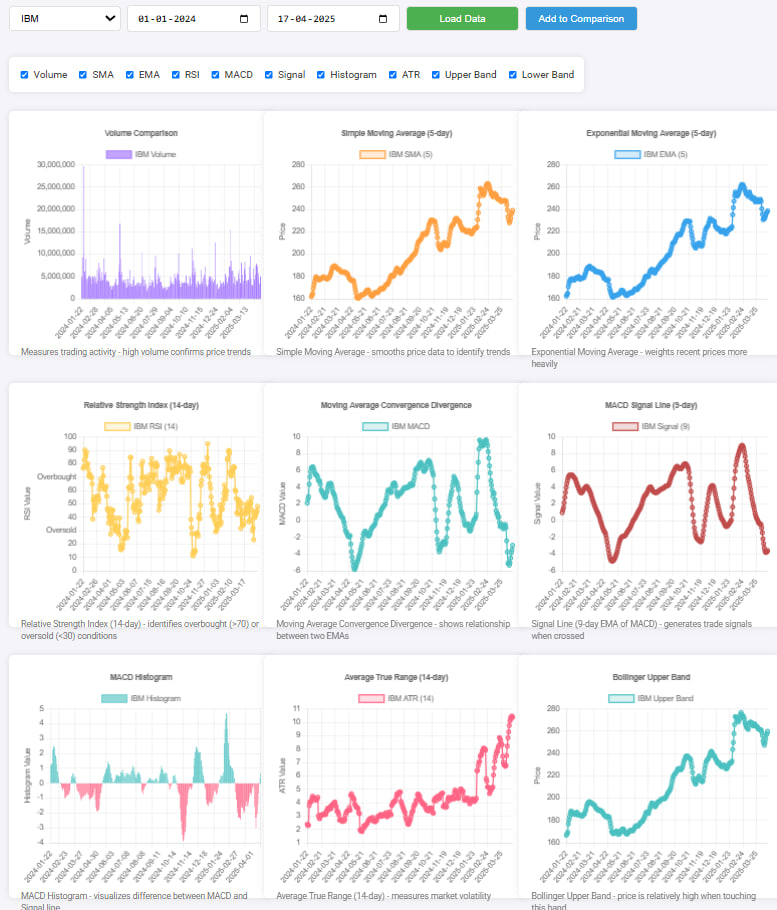
An interactive stock market data visualization tool that helps analyze various stock data indicators with advanced charting features. This project allows users to view multiple financial indicators such as SMA, EMA, RSI, MACD, and others, over customizable date ranges for different stock symbols.
- Stock Data Visualization: Interactive charts displaying stock prices, trading volumes, and various indicators.
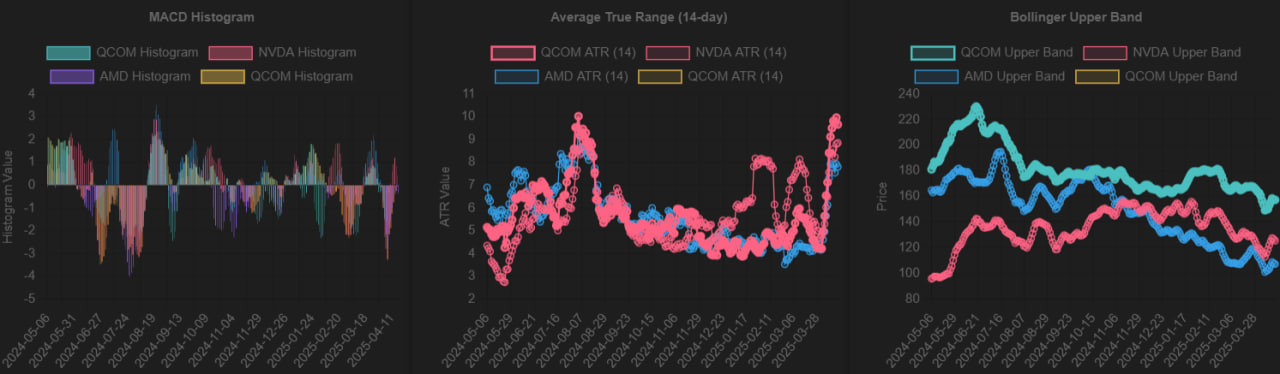
- Technical Indicators: Includes indicators like Simple Moving Average (SMA), Exponential Moving Average (EMA), Relative Strength Index (RSI), Moving Average Convergence Divergence (MACD), and Bollinger Bands.
- Custom Date Range: Select any start and end date for stock data analysis.
- Dark Mode: Toggle dark mode for better user experience.
- Comparison: Add stocks for side-by-side comparison on the same chart.
-
Frontend:
- HTML, CSS, JavaScript for the user interface and interactions.
- Chart.js for making interactive stock charts.
- Plotly.js for advanced charting and data visualization.
- Chart.js Plugin Zoom for zoomable charts.
- chartjs-adapter-date-fns for date-based charting.
-
Backend
- Python for data processing and analysis.
- Pandas for data manipulation and handling stock data.
- NumPy for numerical computations and analysis.
-
Additional Libraries:
- yfinance for fetching stock data from Yahoo Finance.
- Plotly for creating interactive visualizations.
To run this project locally, follow these steps:
First, clone the repository to your local machine:
git clone https://github.com/pavit15/chartsanalyzer.gitMove into the project directory:
cd chartsanalyzerIt’s recommended to create a virtual environment for managing dependencies:
- On Windows:
python -m venv venv
venv\Scripts\activate
- On Mac/Linux:
python3 -m venv venv
source venv/bin/activate
Install the necessary dependencies listed in the requirements.txt file:
pip install -r requirements.txtAfter installing the dependencies, you can run the application using the following command:
python app.pyOnce the application is running, open your browser and visit:
http://localhost:5000The following features are planned for future updates to enhance the project’s functionality:
- Predictive Modeling: Implement machine learning models to predict stock price movements based on historical data, using algorithms like Random Forests, SVM, and LSTM networks.
- Sentiment Analysis: Integrate sentiment analysis of news articles and social media to predict stock price trends based on public sentiment.
- Anomaly Detection: Use unsupervised learning techniques like Isolation Forest or DBSCAN to detect anomalies in stock data and highlight potential investment opportunities or risks.
- Portfolio Optimization: Implement an ML-based portfolio optimization tool using techniques like Markowitz Efficient Frontier and Monte Carlo simulations.
- Backtesting Framework: Develop a backtesting feature to evaluate the effectiveness of trading strategies using historical stock data.
- Advanced Technical Indicators: Add more advanced technical indicators such as Fibonacci Retracements, Parabolic SAR, and Ichimoku Cloud for deeper analysis.
- Real-time Data Integration: Integrate real-time stock market data feeds to perform real-time analysis and trigger alerts for price movements or indicator thresholds.
- Personalized Stock Recommendations: Use collaborative filtering or content-based recommendation systems to provide personalized stock recommendations for users based on their preferences and historical behavior.