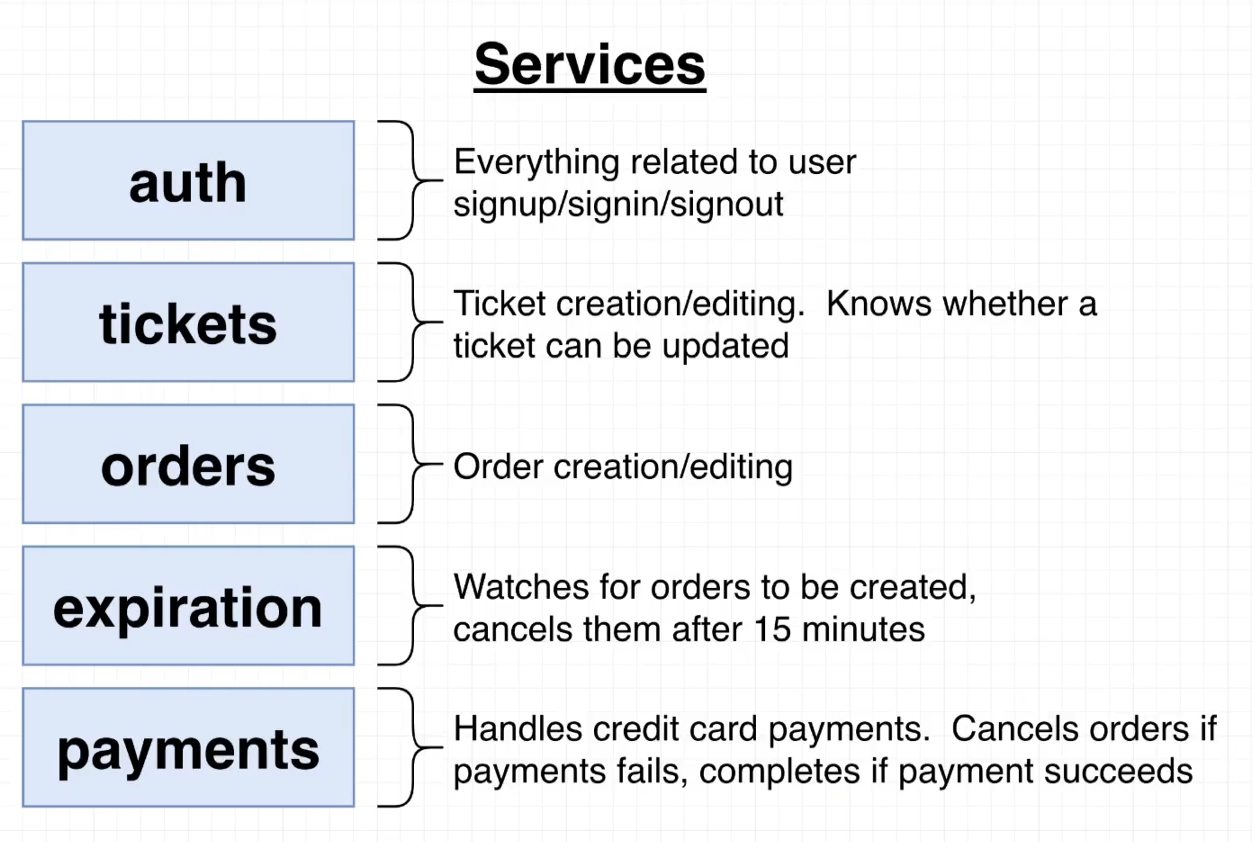
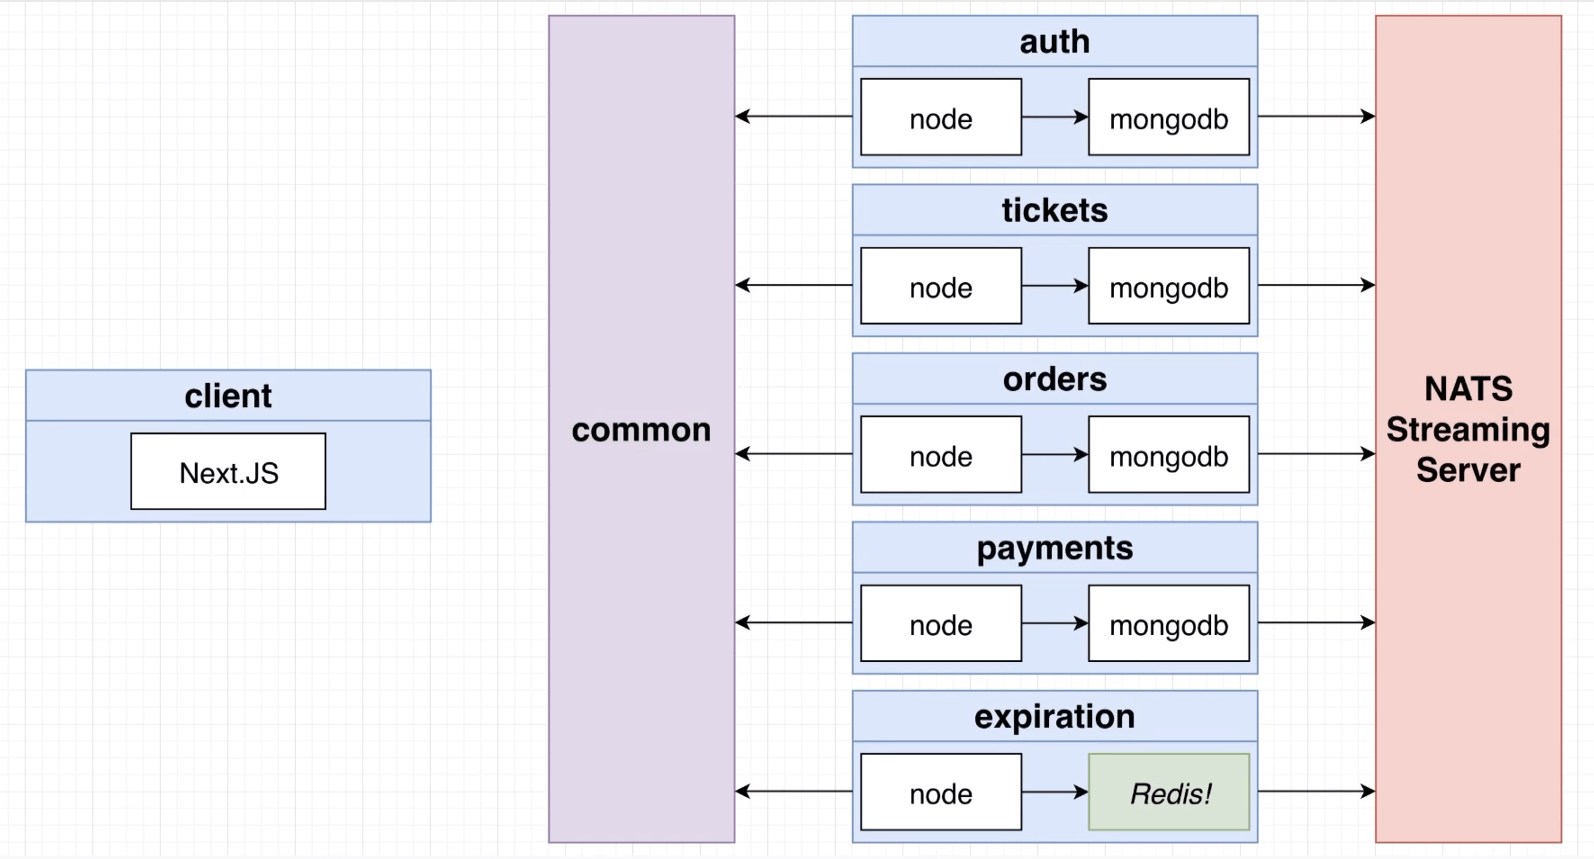
An microservices app created with Express.js, Typescript, MongoDB, BullJS, Docker, Kubernernetes, Ingress-NGINX & NATS.

To install Helm on Unix-based systems:
curl -fsSL -o get_helm.sh https://raw.githubusercontent.com/helm/helm/main/scripts/get-helm-3
chmod 700 get_helm.sh
./get_helm.sh
For other OS or advanced methods, visit: Helm Installation Docs
Using Helm (recommended for custom configuration):
helm repo add ingress-nginx https://kubernetes.github.io/ingress-nginx
helm repo update
helm install ingress-nginx ingress-nginx/ingress-nginx \
  --namespace ingress-nginx --create-namespace \
  --set controller.metrics.enabled=true \
  --set controller.podAnnotations."prometheus\.io/scrape"="true" \
  --set controller.podAnnotations."prometheus\.io/port"="10254"
To uninstall Ingress-NGINX:
helm uninstall ingress-nginx -n ingress-nginx
kubectl delete namespace ingress-nginxhelm repo add prometheus-community https://prometheus-community.github.io/helm-charts
helm repo update
helm install kube-prometheus prometheus-community/kube-prometheus-stack \
--namespace monitoring --create-namespacekubectl apply -k infra/monitoring/To set a JSON web token secret
kubectl create secret generic jwt-secret --from-literal=JWT_KEY=<YOUR_JWT_SECRET>To set a STRIPE secret (needed for payments service)
Create your STRIPE account and get the secret
kubectl create secret generic stripe-secret --from-literal=STRIPE_KEY=<YOUR_STRIPE_SECRET_KEY>Check all created secrets
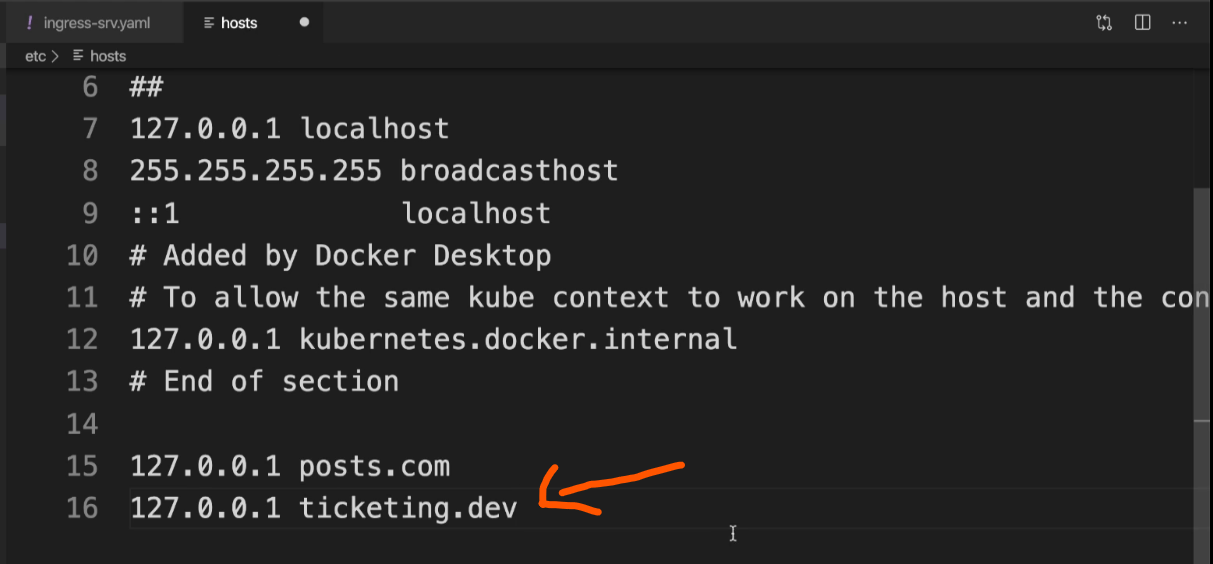
kubectl get secretsskaffold devWe need to edit the host file of our computer to identify our custom route in dev environment.
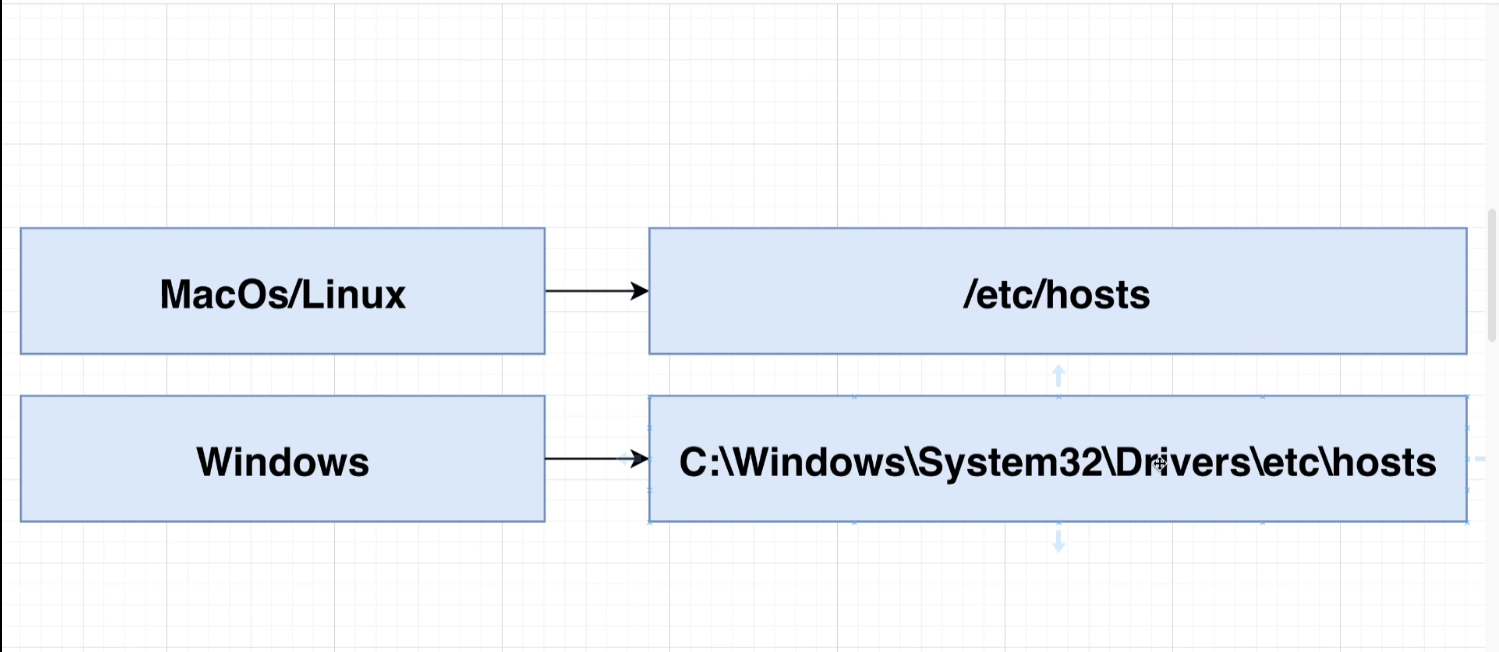
Add 127.0.0.1 ticketing.dev to the host file
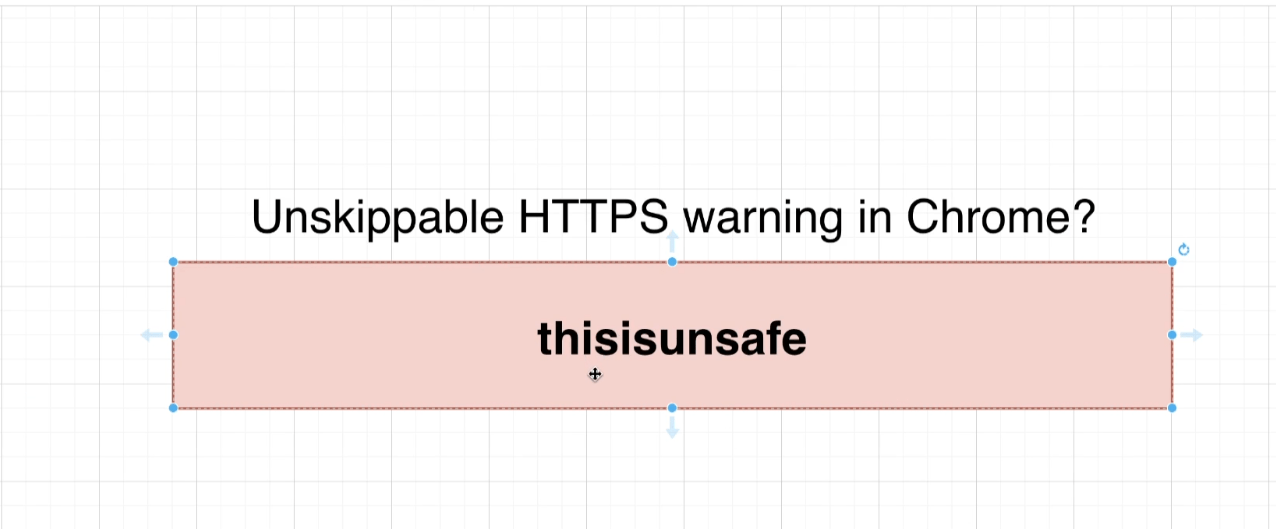
You may face this error in Chrome Browser or Chromium based browsers

To fix the error ->
- Click on the active tab of the browser
- Type
thisisunsafe - The error should gone by now
Services should be running on ticketing.dev if not start by
skaffold devApply config to monitoring services
kubectl apply -k infra/monitoring/Expose Ingress-NGINX Metrics
kubectl port-forward -n ingress-nginx svc/ingress-nginx-controller-metrics 10254:10254access Ingress-NGINX Metrics on http://localhost:10254/metrics
Expose Prometheus Metrics
kubectl port-forward svc/kube-prometheus-kube-prome-prometheus -n monitoring 9090:9090access Prometheus on http://localhost:9090/targets
Expose Grafana Dashboard
kubectl port-forward svc/kube-prometheus-grafana -n monitoring 8080:80access Grafana Dashboard on http://localhost:8080
Grafana Login credentials
username: admin
password: prom-operator- If you see errors like namespace not found, ensure the
monitoringnamespace exists:
kubectl create namespace monitoring- if unable to expose any monitoring service findout their correct names by
kubectl get svc -n monitoring