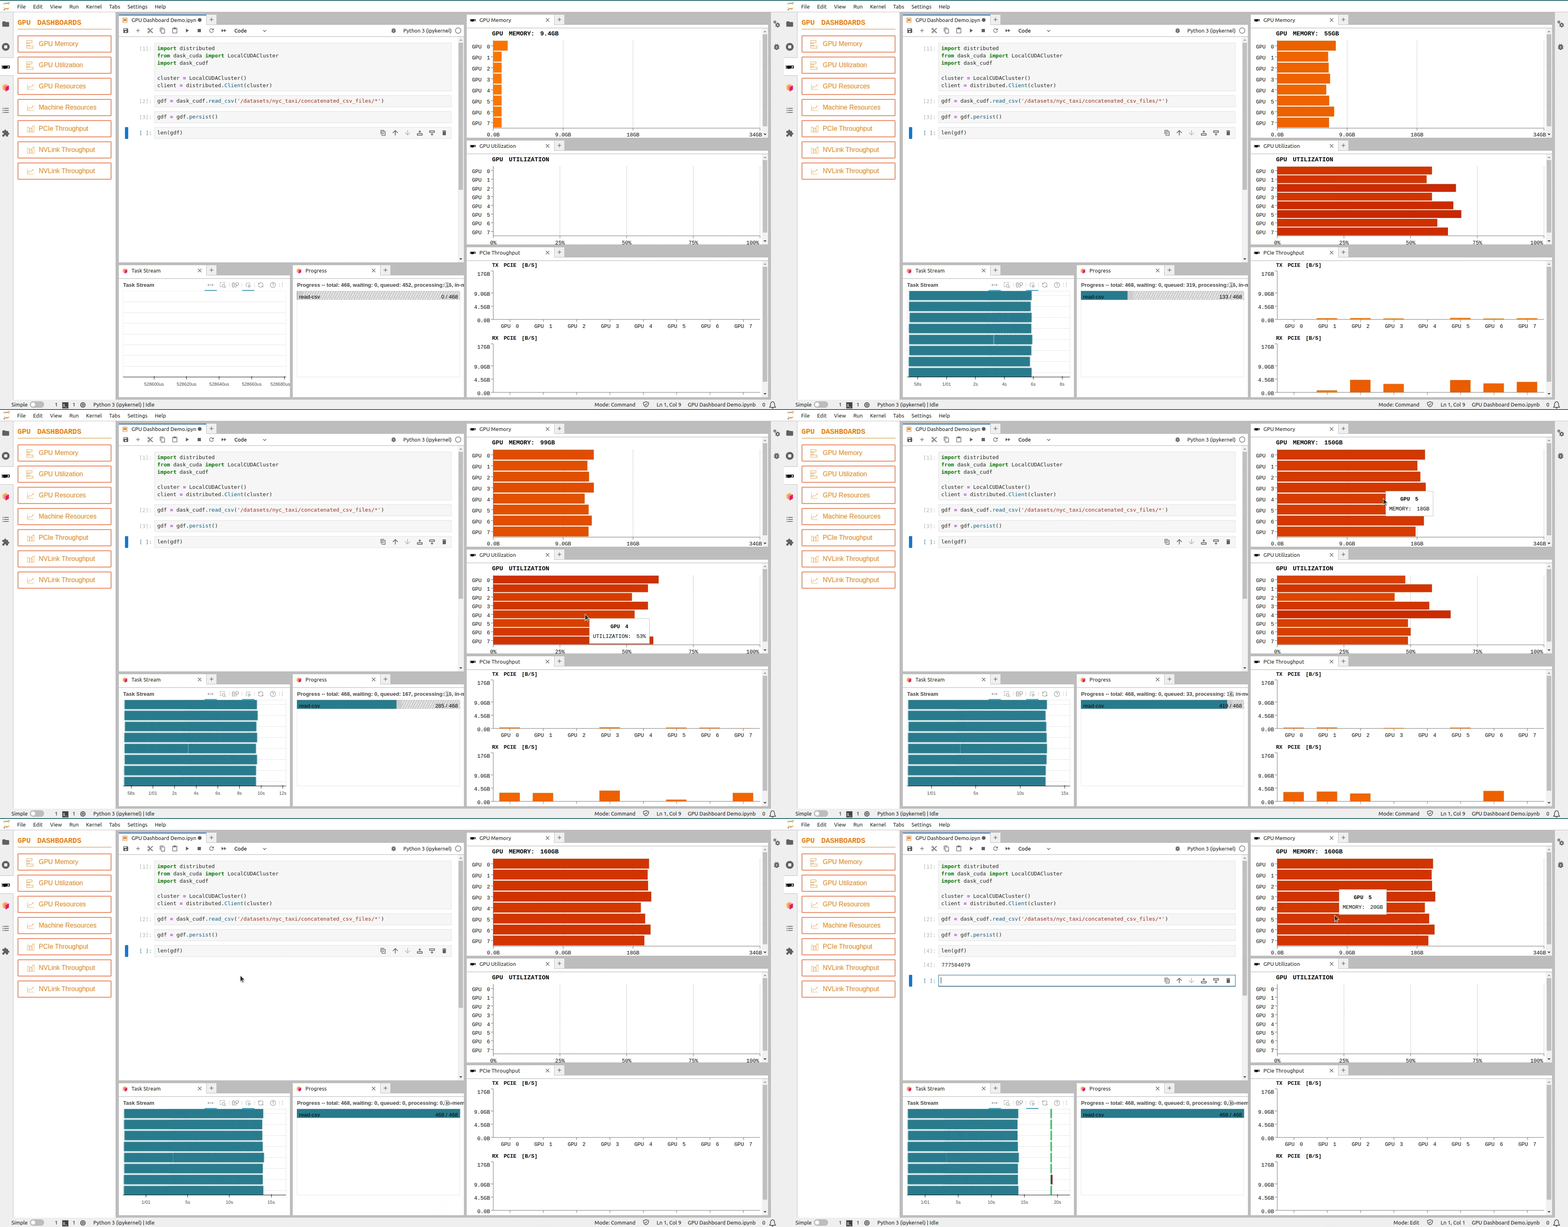
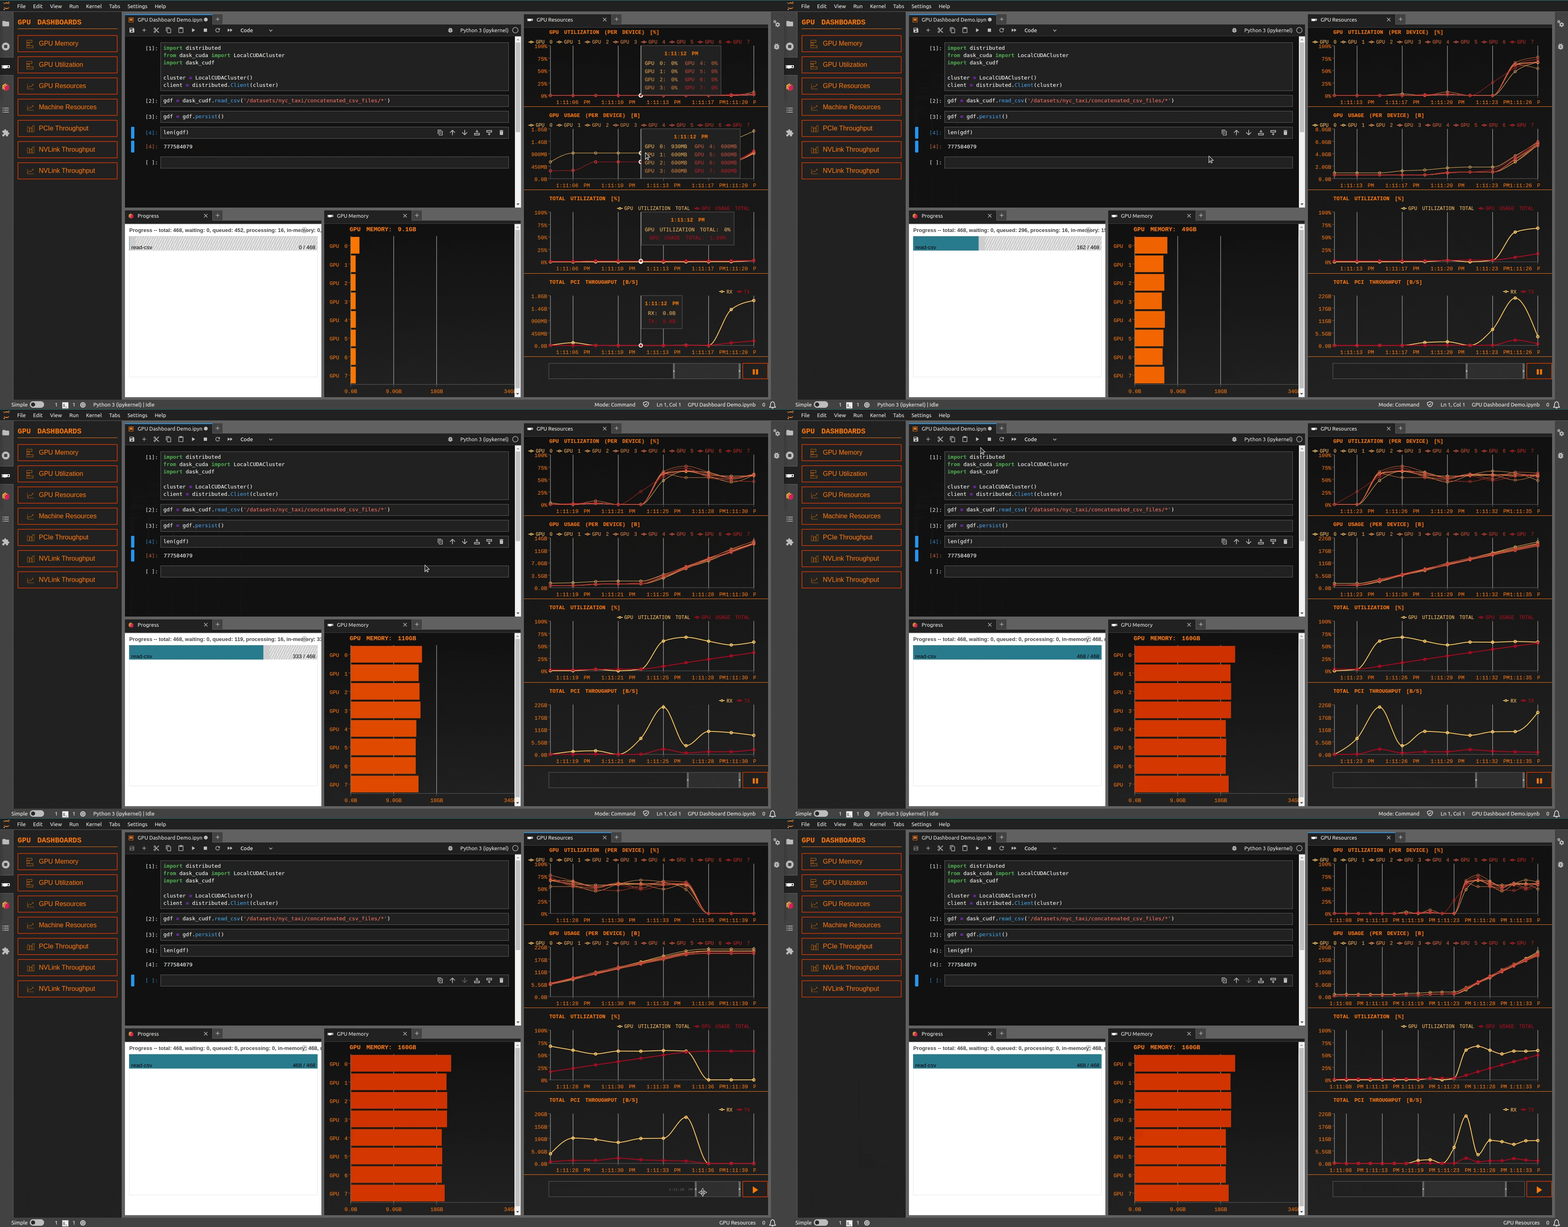
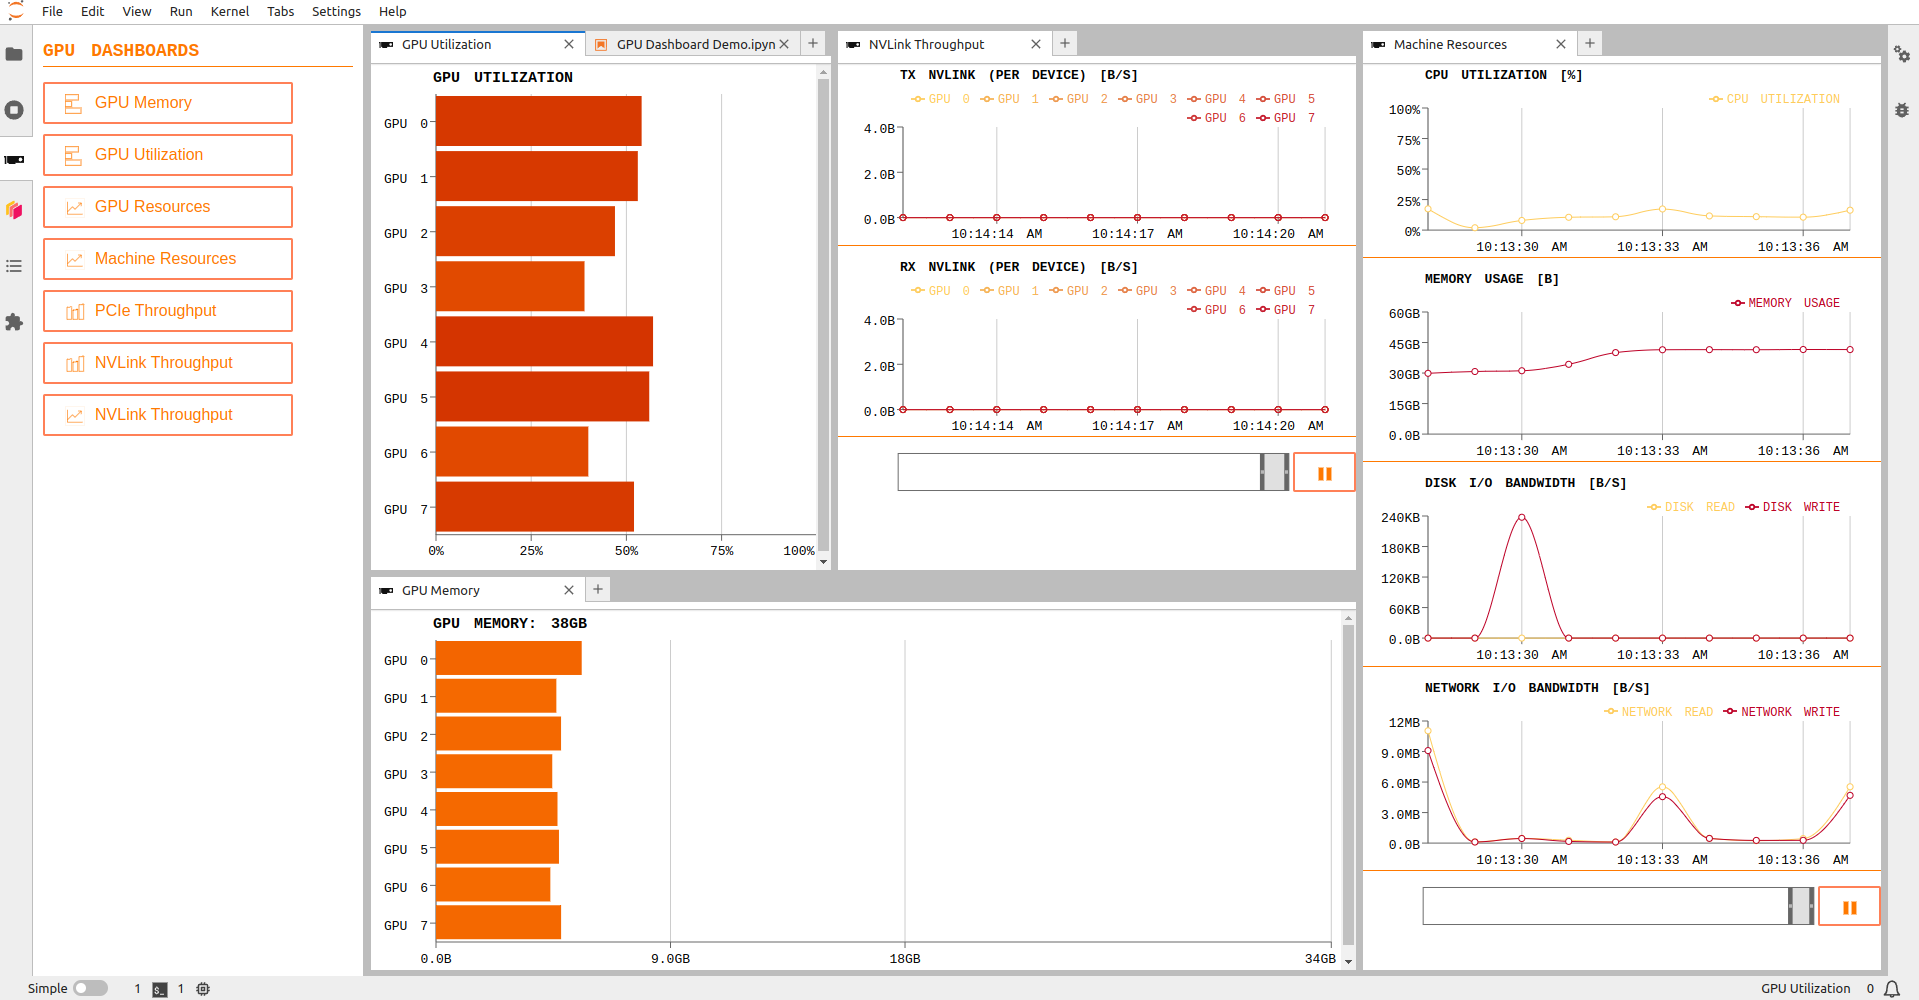
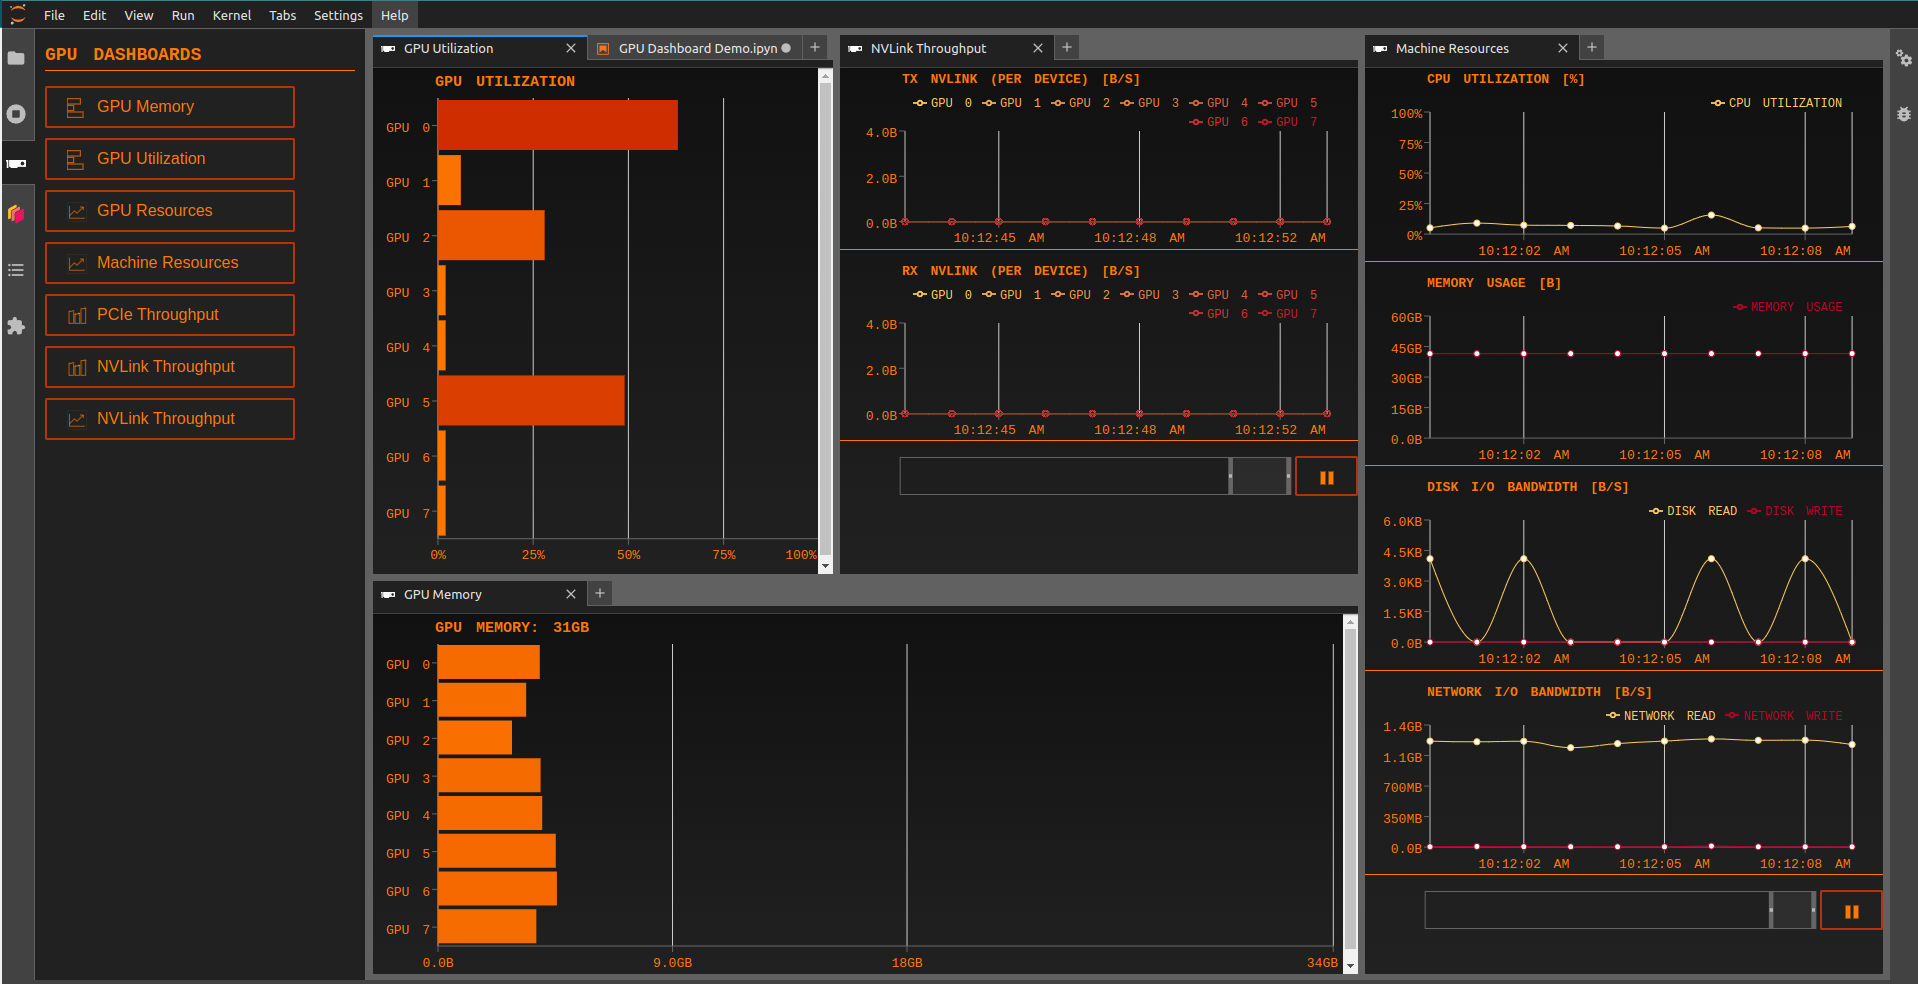
NVDashboard is a JupyterLab extension for displaying GPU usage dashboards. It enables JupyterLab users to visualize system hardware metrics within the same interactive environment they use for development. Supported metrics include:
- GPU-compute utilization
- GPU-memory consumption
- PCIe throughput
- NVLink throughput
- New Features
- Version Compatibility
- Requirements
- Installation
- Troubleshoot
- Contributing
- Future Improvements
JupyterLab-nvdashboard v4 brings a host of new features, improved backend architecture, and enhanced frontend components for an even better user experience. Explore the exciting updates below.
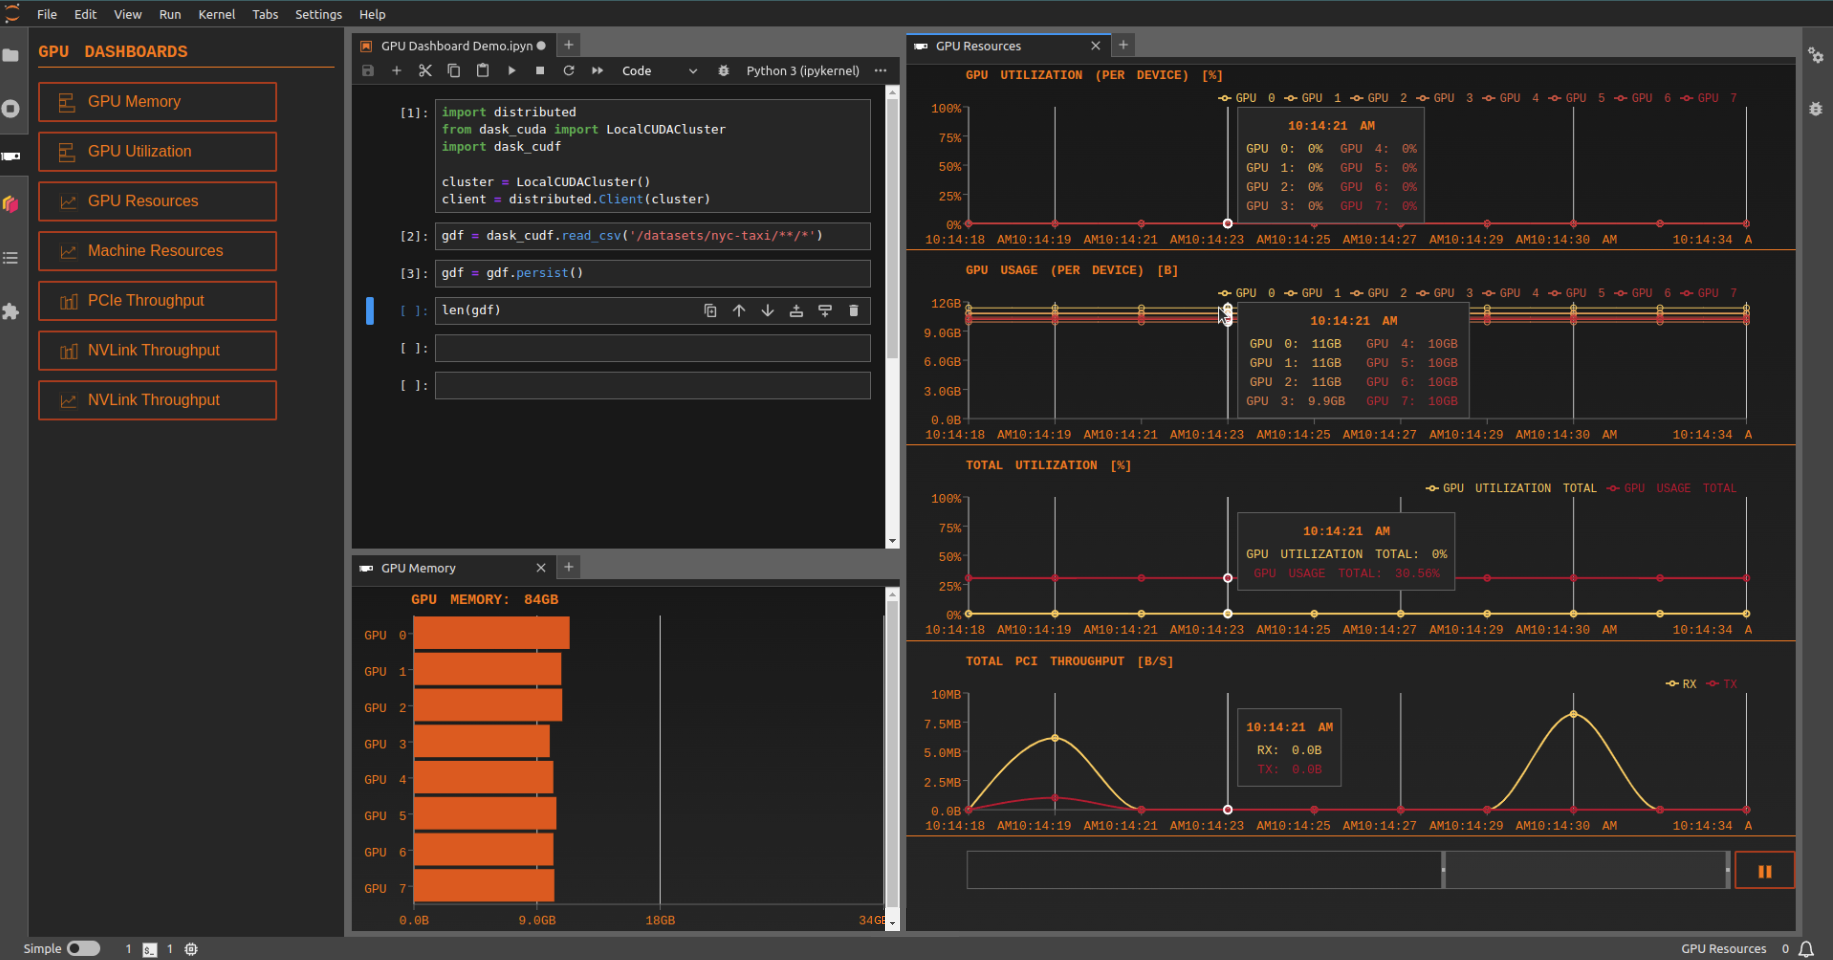
Introducing a powerful brushing feature for time series charts. Users can easily inspect past events by selecting a specific time range, providing more granular control over data exploration.
For pages with multiple charts, JupyterLab-nvdashboard now offers synchronized tooltips for timestamps across all charts. This feature enhances the user's ability to analyze data cohesively and understand relationships between different data points.
Seamless integration with JupyterLab themes is now a reality. The extension adapts its colors and aesthetics based on whether the user is in a light or dark theme, ensuring a consistent and visually appealing experience.
JupyterLab-nvdashboard v4 is designed exclusively for JupyterLab v4 and later versions. To ensure continued support for JupyterLab v3 users, we will maintain the previous version separately (branch-0.9).
- JupyterLab >=4
- pynvml
- psutil
# nightly version (for jupyterlab>=4)
conda install -c rapidsai-nightly -c conda-forge jupyterlab-nvdashboard

# stable version (for jupyterlab<4)
conda install -c rapidsai -c conda-forge jupyterlab-nvdashboard# nightly version (for jupyterlab>=4)
pip install --extra-index-url https://pypi.anaconda.org/rapidsai-wheels-nightly/simple --pre jupyterlab_nvdashboard
# stable version (for jupyterlab<4)
pip install jupyterlab_nvdashboardIf you are seeing the frontend extension, but it is not working, check that the server extension is enabled:
jupyter server extension listIf the server extension is installed and enabled, but you are not seeing the frontend extension, check the frontend extension is installed:
jupyter labextension listFor more details, check out the contributing guide.
While we've introduced a range of exciting features in this release, we understand that there are always opportunities for improvement. We have noted a request to add cell execution markers to the charts. Due to the complexities associated with asynchronous cells, we have decided to defer this feature to a future update. Rest assured, we will explore this enhancement in subsequent releases.
