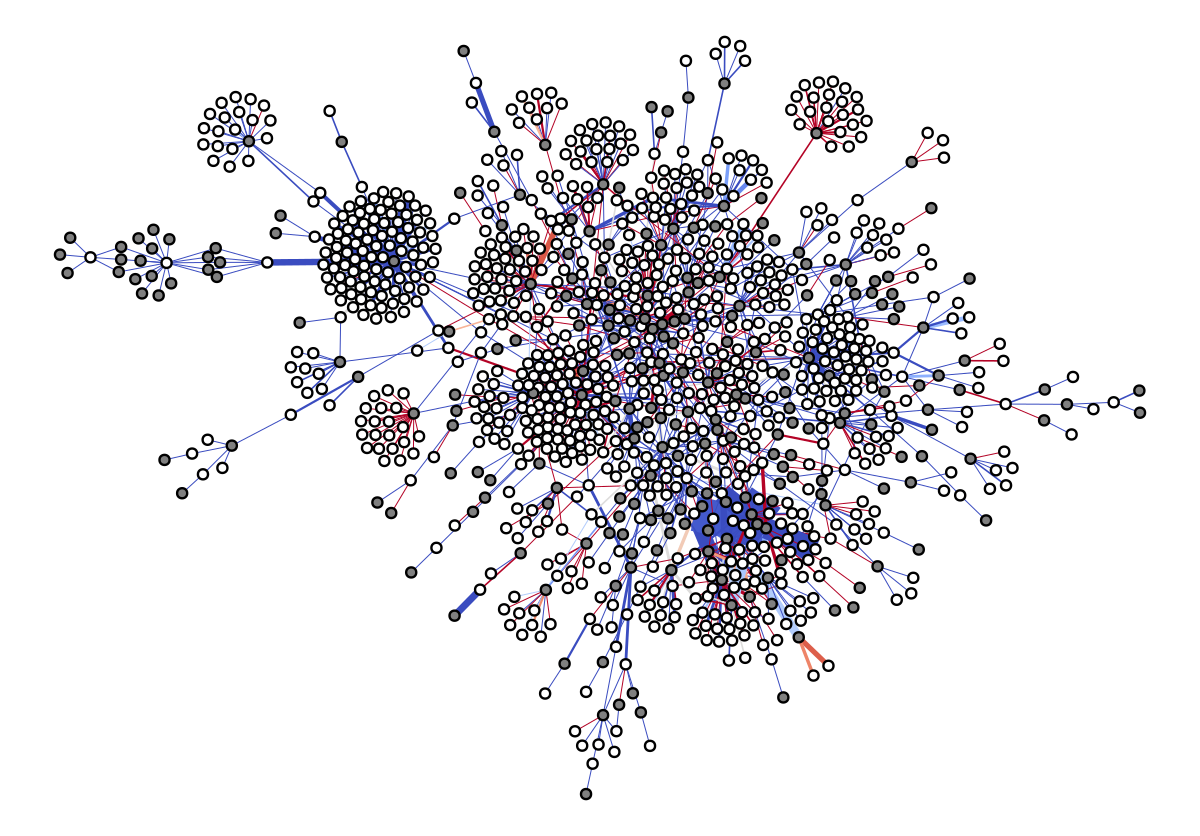
This project analyzes EU procurement contract network data for the Applied Network Analysis course (GRAD-E1426) taught by Phillip Lorenz-Spreen at the Hertie School in Berlin. I collaborated with fellow Hertie students Kai Foerster, Danial Riaz, and Lukas Lehmann to perform the analysis and present our findings.
eu_procurements_alt: A collection of 234 networks representing the annual national public procurement markets of 26 European countries from 2008-2016. Data is sourced from Tenders Electronic Daily (TED), the official procurement portal of the European Union. Nodes with the suffix "_i" represent issuers (sometimes referred to as "buyers") of public contracts, for instance public hospitals, ministries, and local governments. Nodes with the suffix "_w" represent winners (sometimes referred to as "suppliers") of public contracts, generally private-sector firms. Each network is bipartite: links represent contracting relationships between issuers and winners.
label: IDs of issuers and winners are consistent across time and within countries. Node IDs have been randomly generated and do not correspond to any official statistics. Identities have been statistically de-duplicated, as described in the paper by Wachs, Fazekas, & Kertész.
count: Measures the volume of contracts between the issuer and winner in the given year. This attribute can be interpreted as a weight or strength of the relationship.pctSingleBid: Describes the share of contracts between the issuer and winner awarded without competition, i.e. with the winner as single bidder or sole-supplier. This is an elementary indicator of corruption risk of the contract. For more information consult the paper referenced above.
- Throughout the project workflow, Google Colab was used to write and execute Python code. Code provided by Tiago P. Peixoto (@count0) enabled the use of the
graph-toolpackage within the Google Colab environment. - The
eu_procurementsdataset was imported directly from thegraph-toolspackage. - Several network properties are examined including degree distribution and the distribution of links with higher than average percentage of single bid contracts (an indicator of potential corruption).
- Since the network is partitioned into two sets (e.g., issuers and winners) and links exclusively connect the nodes of one set to the nodes of the other, the network is considered bipartite. To perform a thorough analysis, the network is converted into two separate network projections, one for issuers and one for winners, using the
NetworkXpackage. - Several network analysis techniques such as centrality measures, density measures, and community detection are applied to the bipartite network projections to better understand their structure.
eu_procurements_altEU national procurement networks (2008-2016) dataset- J. Wachs, M. Fazekas, and J. Kertész; "Corruption Risk in Contracting Markets: A Network Science Perspective." International Journal of Data Science and Analytics, pp 1–16 (2020), https://doi.org/10.1007/s41060-019-00204-1.
- A. Barabási; Network Science. Cambridge University Press (2015), http://www.networksciencebook.com/.
- T. Fruchterman and E. Reingold; "Graph drawing by force-directed placement." Journal of Software: Practice and Experience, pp 1129-1164 (1991), https://doi.org/10.1002/spe.4380211102.
NetworkXDocumentationgraph-toolDocumentation- DataCamp | Python Tutorial: Bipartite graphs
- Contracts data dictionary associated with the
eu_procurementsdata set can be found here. - Code provided by Tiago P. Peixoto (@count0) enabled the use of the graph-tool package in the Colab environment.
- How to Use Graph-Tool in Google Colab
