Quality Assessment Prediction
⏪ User Guide >> 2. Quality Assessment Prediction
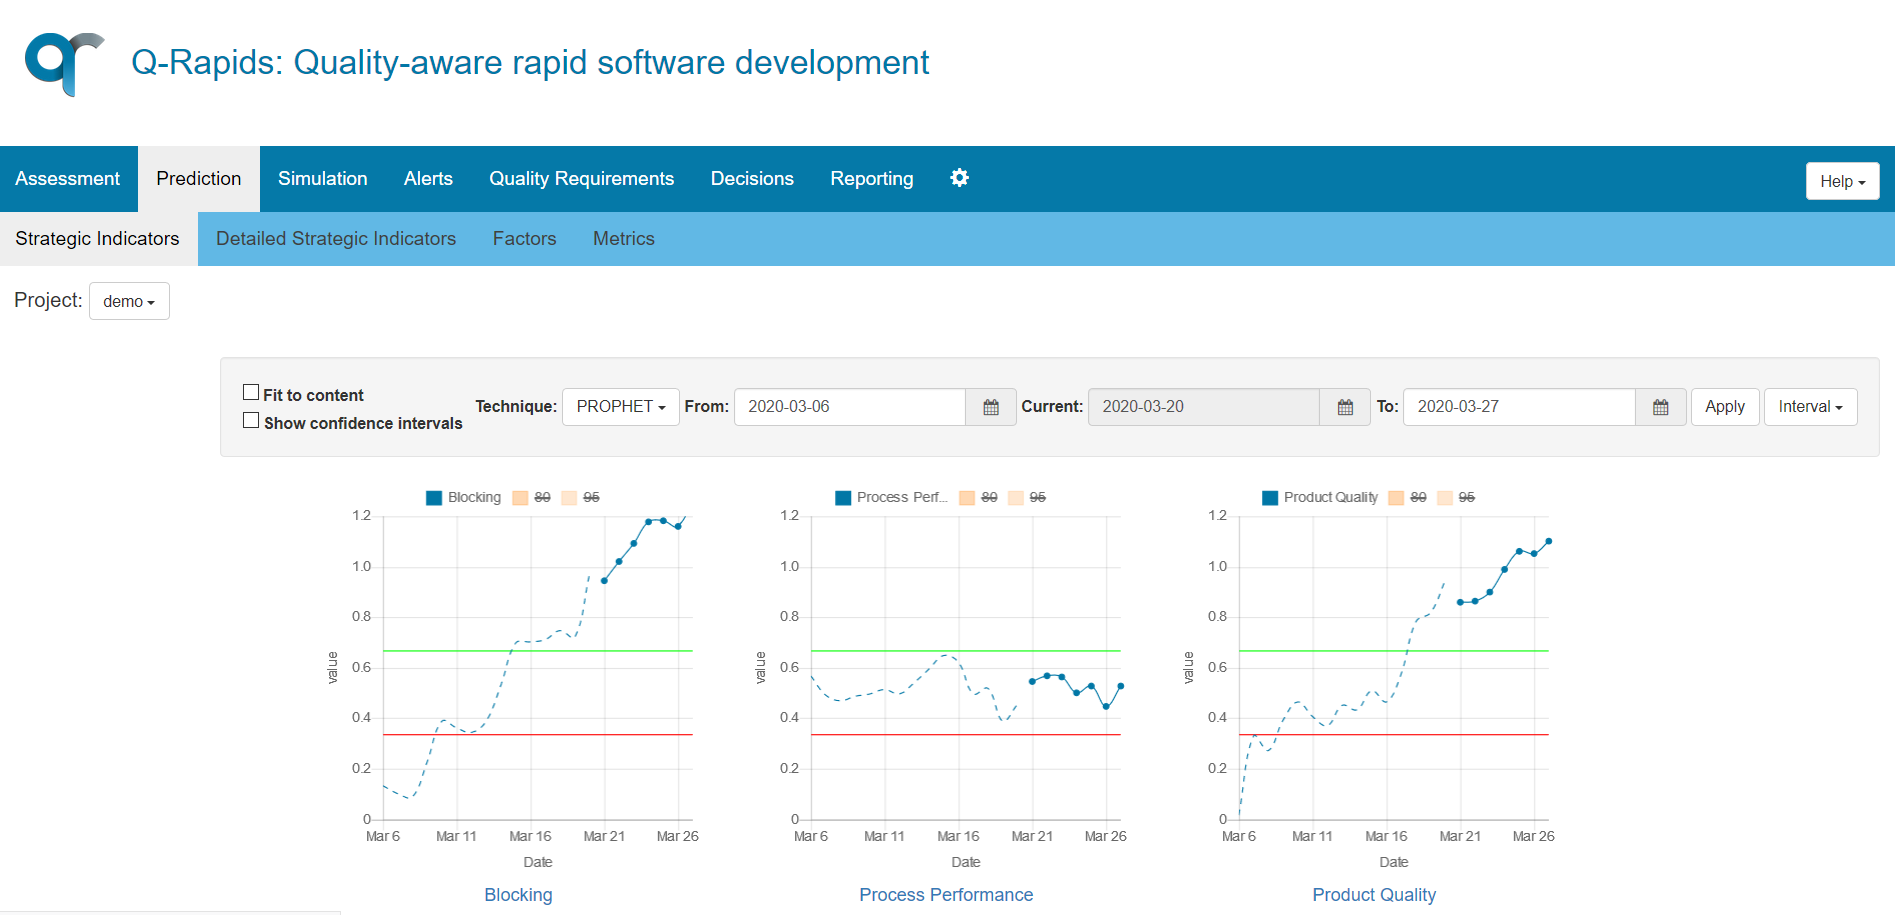
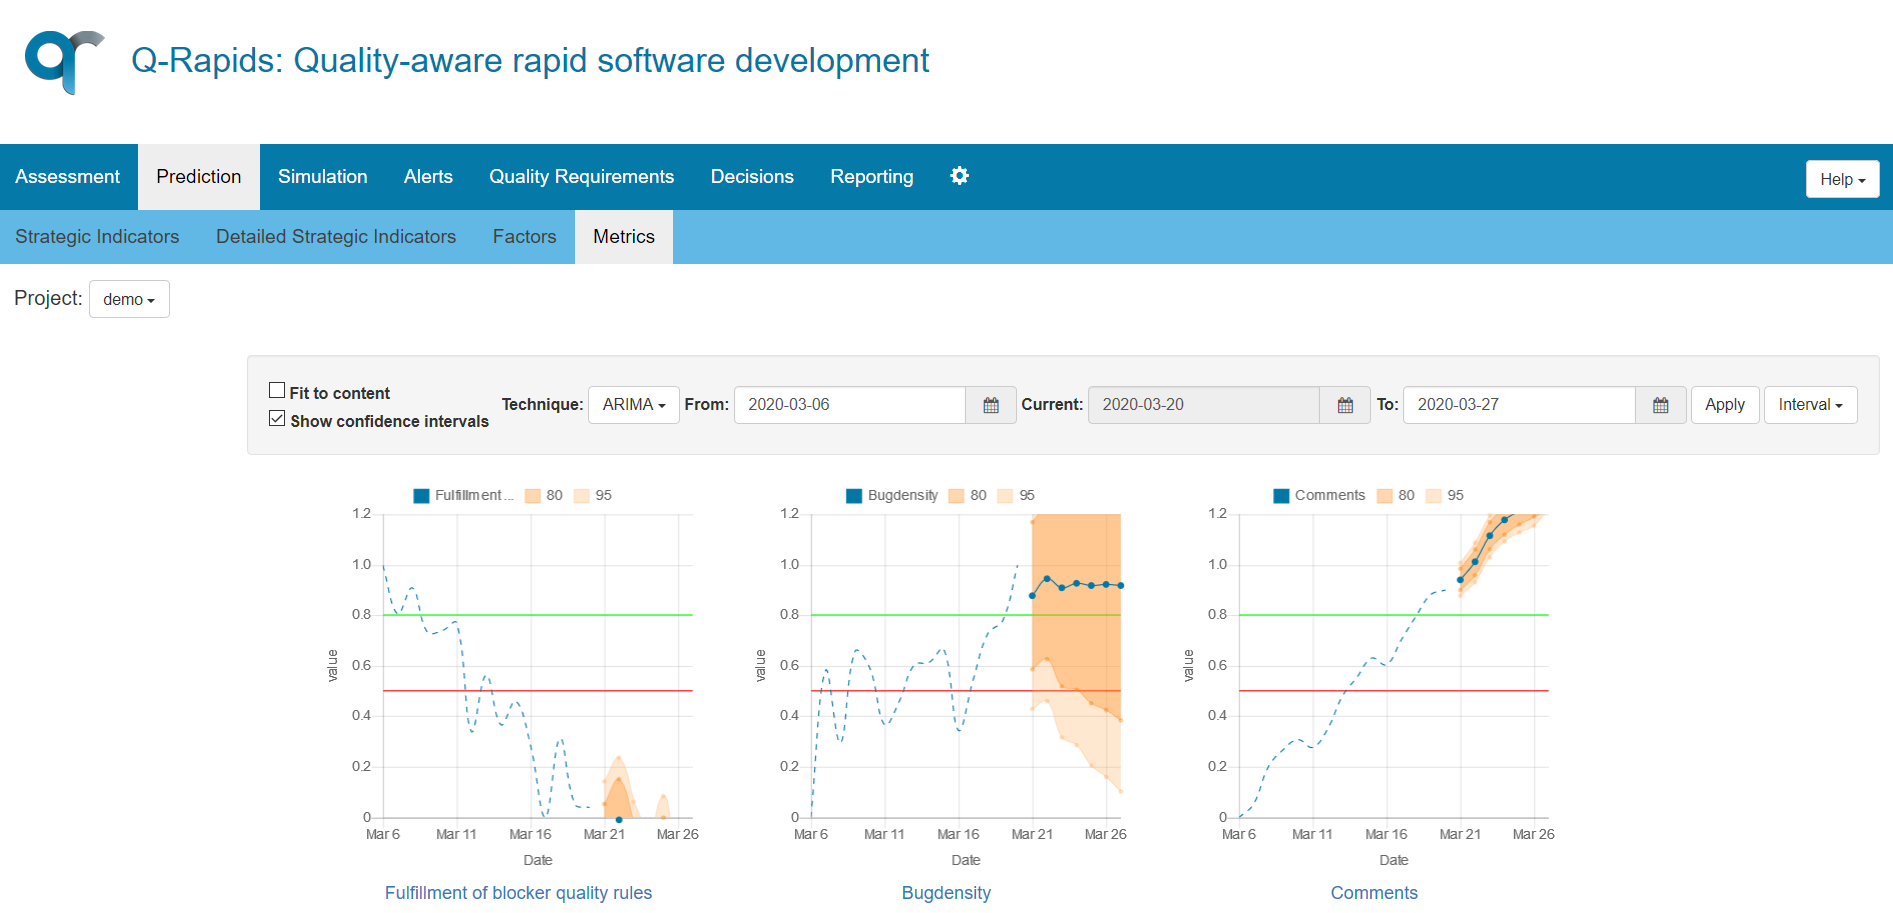
The Prediction functionality allows the user to see the assessment forecasting of the quality model elements. Apart from seeing the assessment forecasting of the quality model elements, the user can see a portion of historical data and an intervals of confidence in the views of Strategic Indicators and Metrics.
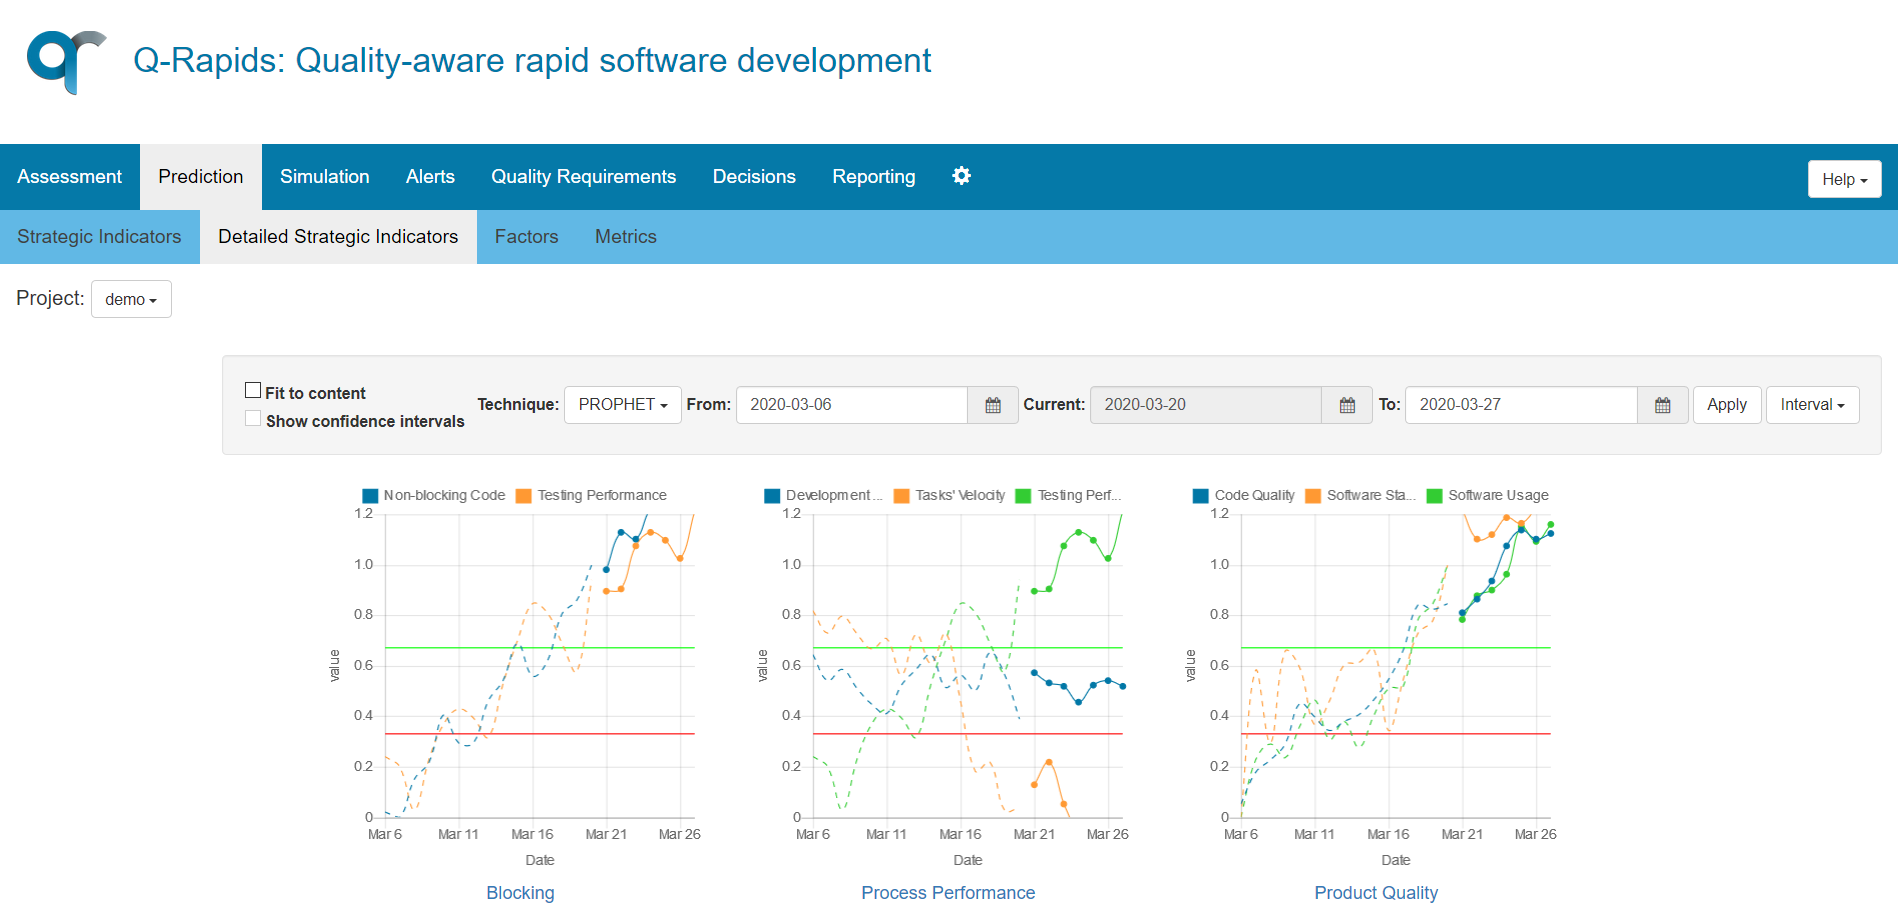
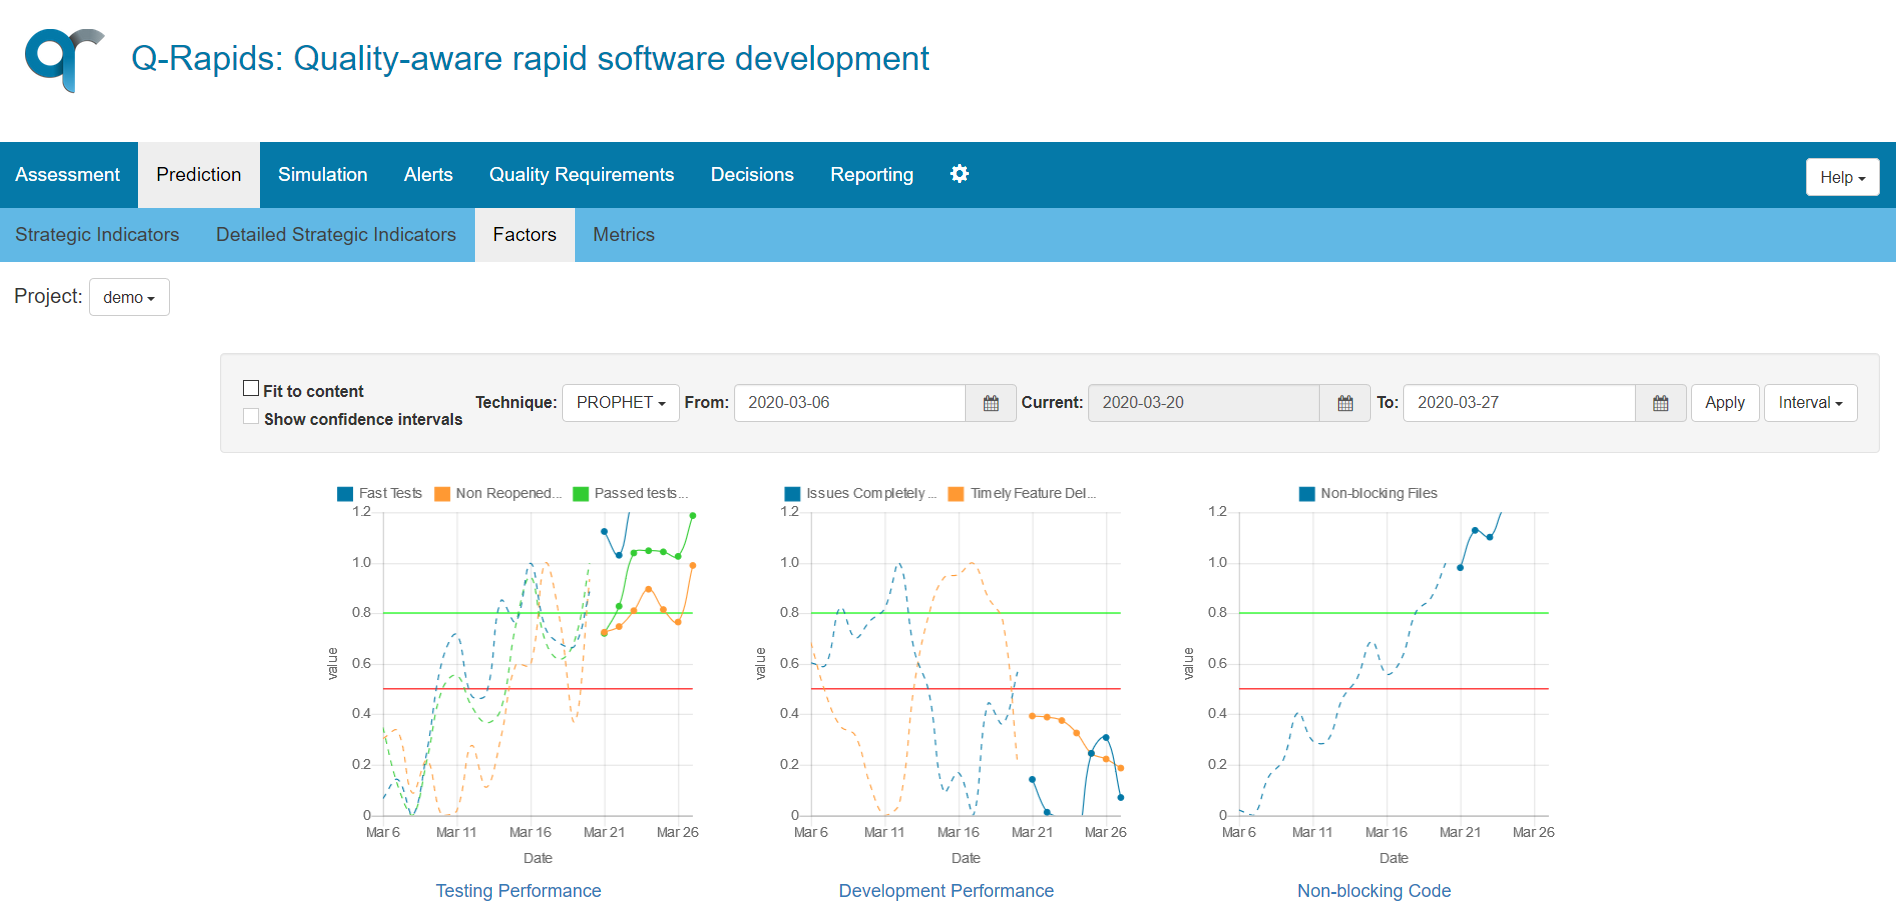
The contextual menu for this option shows four data views: Strategic Indicators, Detailed Strategic Indicators, Factors ,and Metrics.
![]() Project Evolution Video Tutorial
Project Evolution Video Tutorial
In order to perform the prediction, the user must choose the desired data view, select the desired forecasting technique with the dropdown and adjust the horizon of the prediction in the date filter at the top of the assessment area. Other parameter that can be adjusted is the from-date value for historical data, it can be selected in the date filter at the top of the assessment area.
The prediction always starts from the current day, and the representation of the data is only available in graphical mode, showing line charts with one or several time series depending on the Data View. The difference between historical data and predicted data is shown by using dashed lines for historical one.
On views of Strategic Indicators and Metrics is available the special option (Show confidence intervals) that shows intervals of confidence on all of graphs. It's also possible to activate or deactivate intervals of confidence for a single graph by use of corresponding chart legend.