-
Notifications
You must be signed in to change notification settings - Fork 3
2.2. Alignment
There are two pages on this tab.
An overview of alignment metrics for all samples is shown here. Select any metric in the drop down menu to visualize and move your cursor on the box plot to display descriptive statistics.
A full metrics table is available for download by clicking the download button.
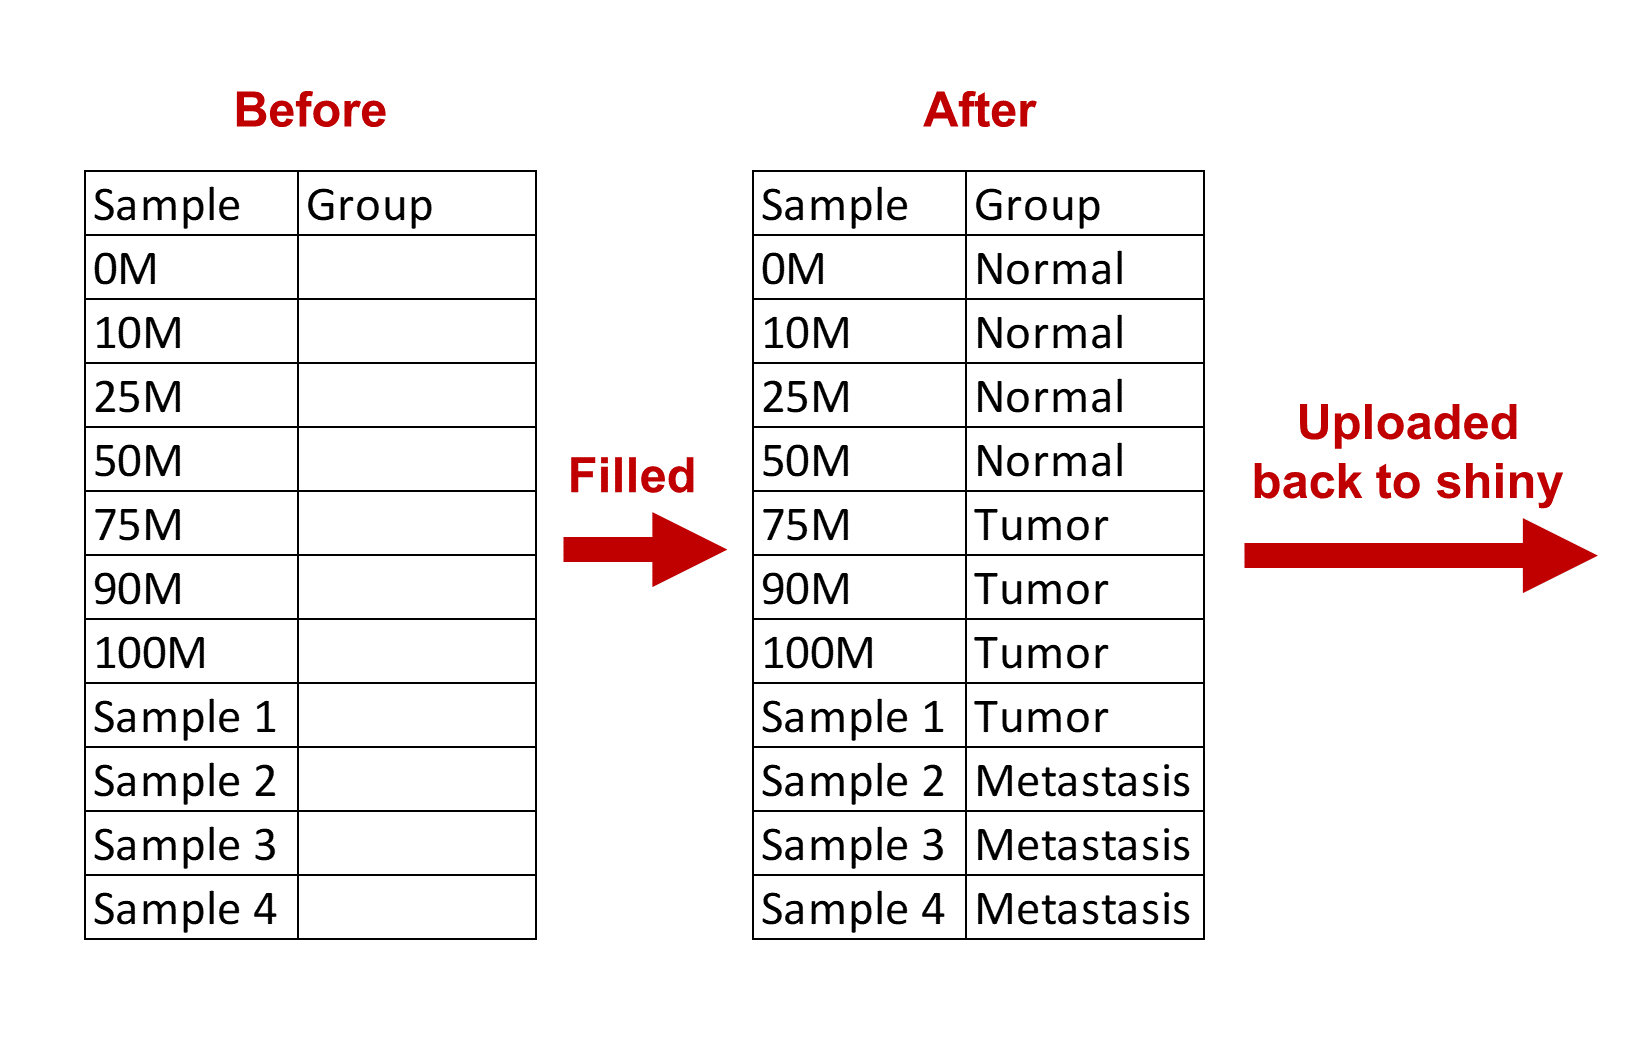
The metrics can be visualized by group. A template containing all of the samples is automatically prepared for you, click the download button to download.
You need to enter the group of each sample into the Group column of the annotated file to be uploaded. You can leave any sample blank since it does not affect the program performance. Upload the filled file to shiny server by clicking the browse button.

An example is available to download here.
Now the metrics are plotted by group. You are free to move your cursor on any box plot to display descriptive statistics.