-
Notifications
You must be signed in to change notification settings - Fork 3
2.5. Epipolymorphism
thinhong edited this page Oct 28, 2020
·
3 revisions
Epipolymorphism score is computed as:
 [1]
[1]
pi is the percentage of pattern i.
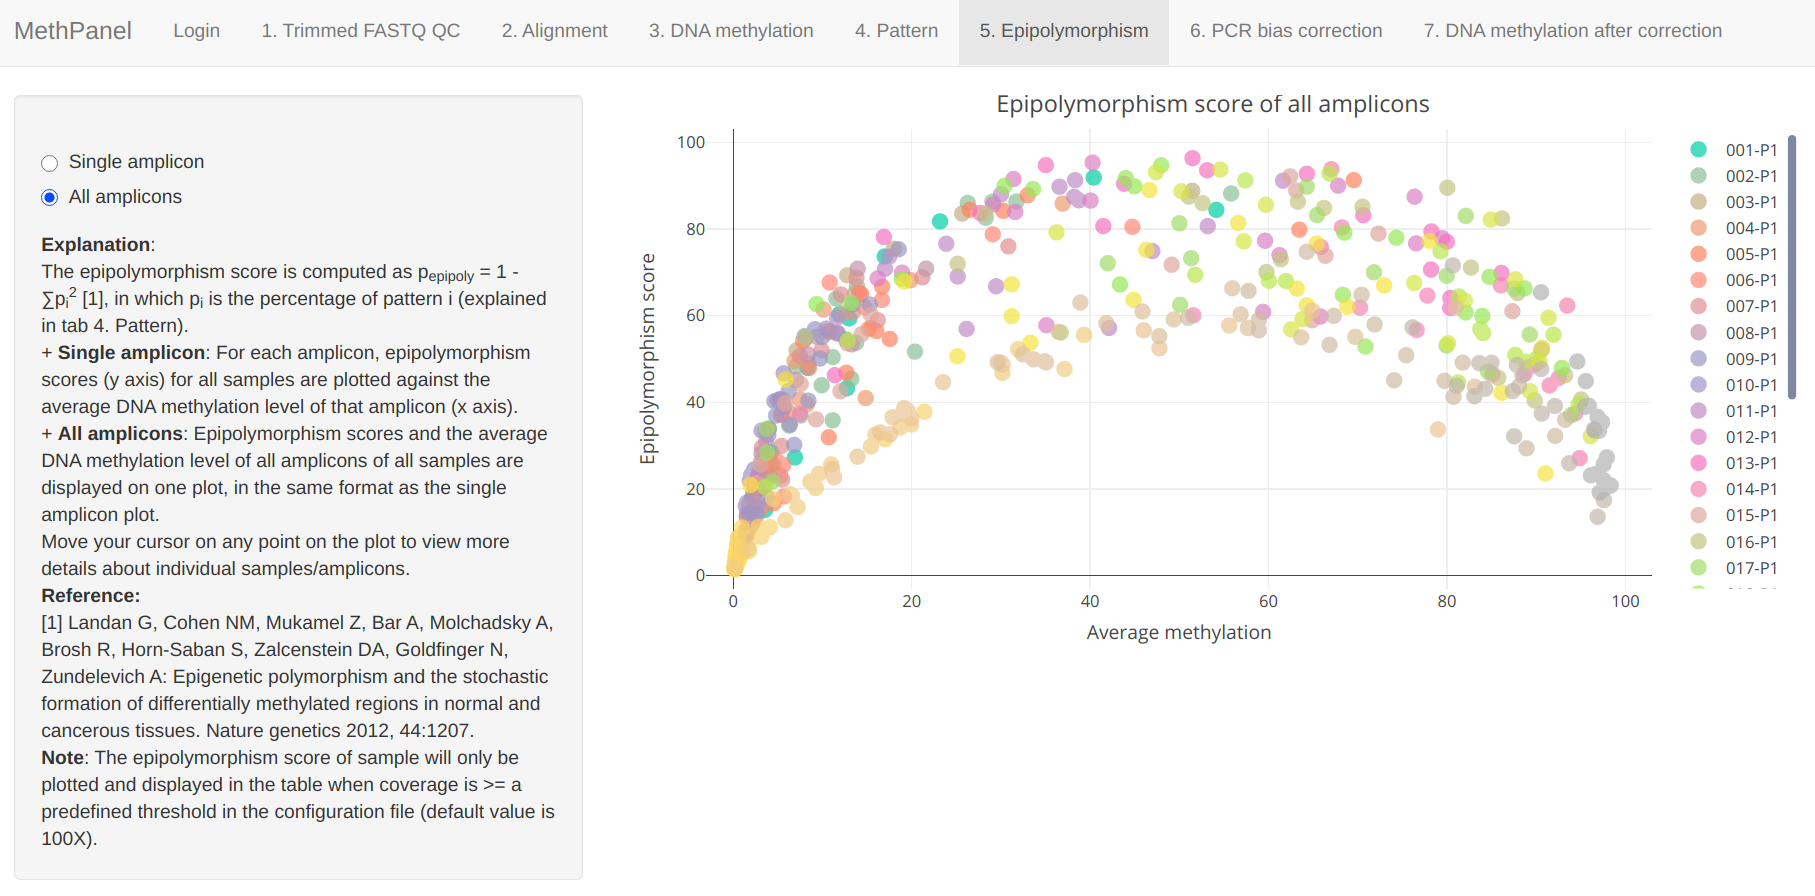
Epipolymorphism scores are plotted together with DNA methylation level to show their relationship for all amplicons. Move your cursor on any point on the plot to view more details.

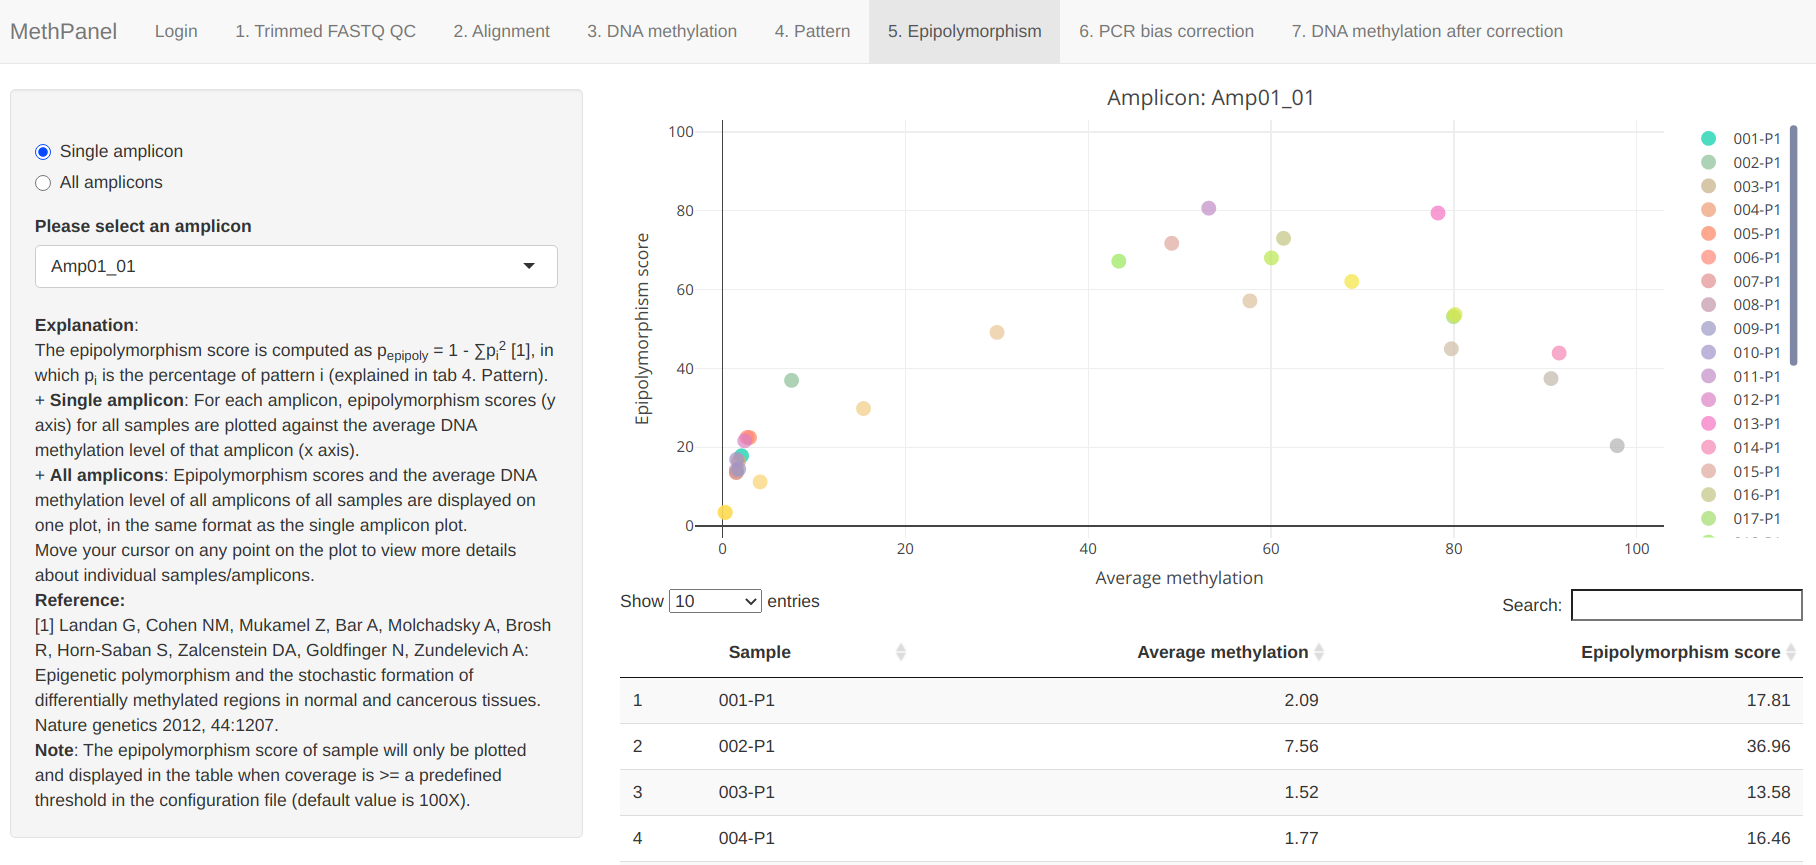
Epipolymorphism scores can be plotted for each amplicon by selecting "Single amplicon" option.

References
- Landan G, Cohen NM, Mukamel Z, Bar A, Molchadsky A, Brosh R, Horn-Saban S, Zalcenstein DA, Goldfinger N, Zundelevich A: Epigenetic polymorphism and the stochastic formation of differentially methylated regions in normal and cancerous tissues. Nature genetics 2012, 44:1207.